

This is the first mapping of global sex frequency. The analysis covers 107.9 million data points from more than 70 thousand respondents from 1986 to 2023. It is by far the largest study of sexual frequency ever conducted in history.
You may use material from this report as long as you refer to this original report. For access to the full dataset, special requests, or questions, email researchcenter@bedbible.com. Data can be delivered in different formats fitting to the statistical program of your choosing (SpSS, Stata, R, SQL, or as a plain CSV).
The below article presents some of the results of the analysis of this dataset.
It is said that the frequency of sex is closely related to a happy relationship. However, connection and satisfaction are also both crucial factors to have a healthy and happy sexual relationship.
Whether you are in a committed or casual relationship, you may be wondering how frequently other couples have sex.
Key Takeaways
- People on average have sex 3.9 times per week.
- 25% report to have sex every week.
- People are having less sex (measured on a year-by-year basis from 1989 – 2023).
- By age groups:
- The most sexually active age group is 25-34, where people have sex on average 7.3 times per month.
- 50-80 year olds report to have sex twice a month
- By Relationship Status:
- Couples on average have sex 5.8 times per month.
- Married couples on average have sex less frequently (5.2 times per month).
- 26% of couples report to have sex once a week on average.
- Singles on average have sex 2.2 times per month.
- 7% of couples report to only have had sex 1-2 times in the past year.
- Couples younger than 24 is the age group that has sex most often (9.1 times per month).
Table of contents
- Statistics on the Average Sexual Frequency of Americans Per Week, by Relationship Status
- Statistics on the Average Number of Times Couples Have Sex Per Week
- Statistics on the Estimated Times Per Year American Adults had Sex, 1989–2021
- Statistics on the Sex Frequency of People Between Ages 50-80
- Statistics on American Men Who Had Sex with Someone in a Public Place
- Statistics on the Intercourse Rates Amongst Single and Married Persons in the U.S. (by age group)
- Statistics on the Impact of Coronavirus Pandemic on Sexual Life of Women in the U.S. (2021)
- Statistics on the Impact of Pandemic on Interaction with American Women
- Factors Most Often Associated with the Frequency of Sexual Intercourse
Charts of Sex frequency, by age, gender, and relationship status
In the following sections we reveal the main data on the sexual frequency for people aged 18-75+.
Sex frequency per month, all, by age and gender
First, some data on all people (no matter the relationship status):
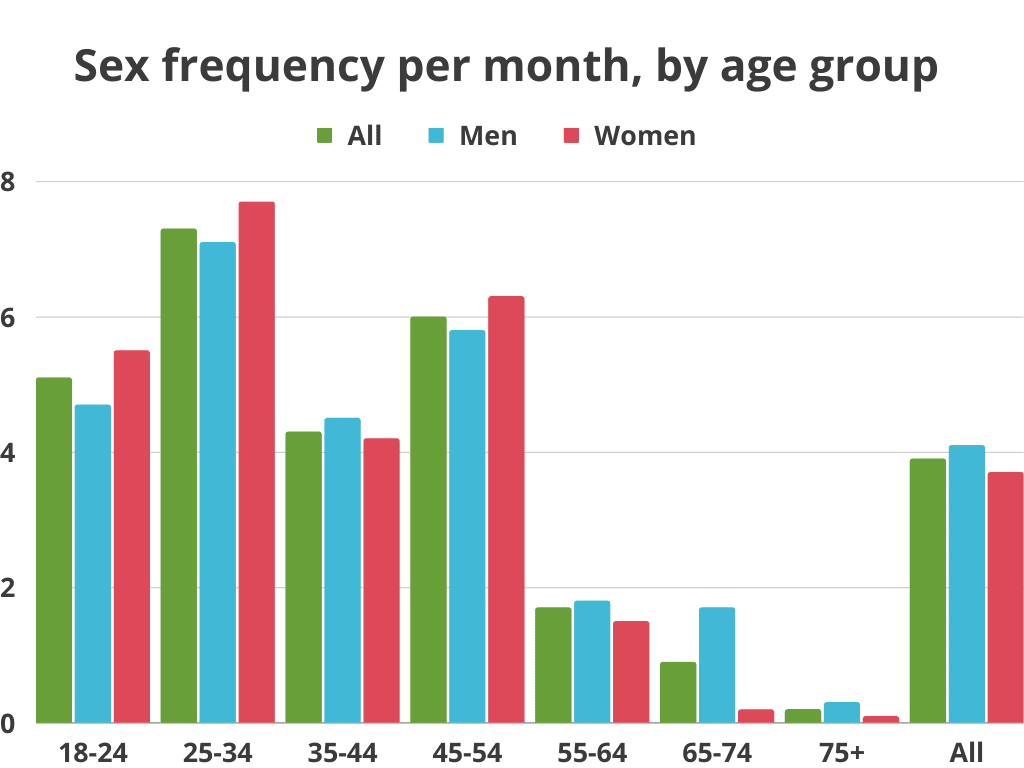
| All, Age groups | Sex Frequency per month | | | Men | Women |
|---|---|---|---|---|
| 18-24 | 5.1 | | | 4.7 | 5.5 |
| 25-34 | 7.3 | | | 7.1 | 7.7 |
| 35-44 | 4.3 | | | 4.5 | 4.2 |
| 45-54 | 6.0 | | | 6.3 | 5.8 |
| 55-64 | 1.7 | | | 1.8 | 1.5 |
| 65-74 | 0.9 | | | 1.7 | 0.2 |
| 75+ | 0.2 | | | 0.3 | 0.1 |
| All | 3.9 | | | 4.1 | 3.7 |
Sex frequency of couples, per month, by age and gender
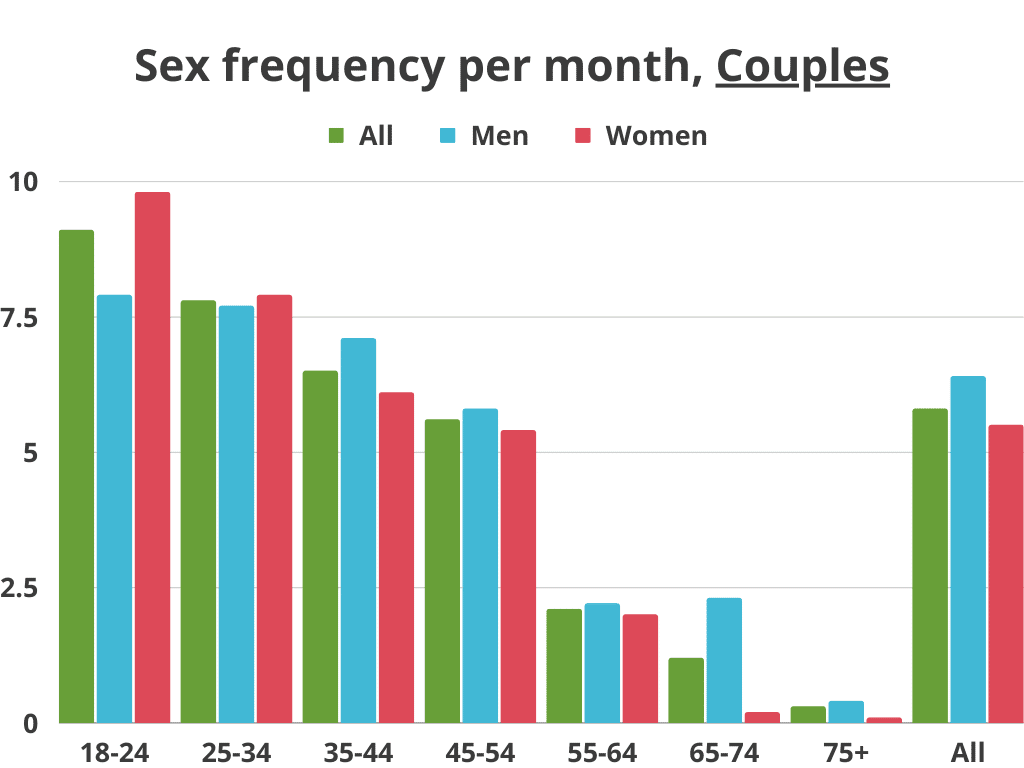
| Couples, by age groups | Sex Frequency per month, | | | Men | Women |
|---|---|---|---|---|
| 18-24 | 9.1 | | | 7.9 | 9.8 |
| 25-34 | 7.8 | | | 7.7 | 7.9 |
| 35-44 | 6.5 | | | 7.1 | 6.1 |
| 45-54 | 5.6 | | | 5.8 | 5.4 |
| 55-64 | 2.1 | | | 2.2 | 2.0 |
| 65-74 | 1.2 | | | 2.3 | 0.2 |
| 75+ | 0.3 | | | 0.4 | 0.1 |
| All | 5.8 | | | 6.4 | 5.5 |
Sex frequency of singles, per month, by age and gender
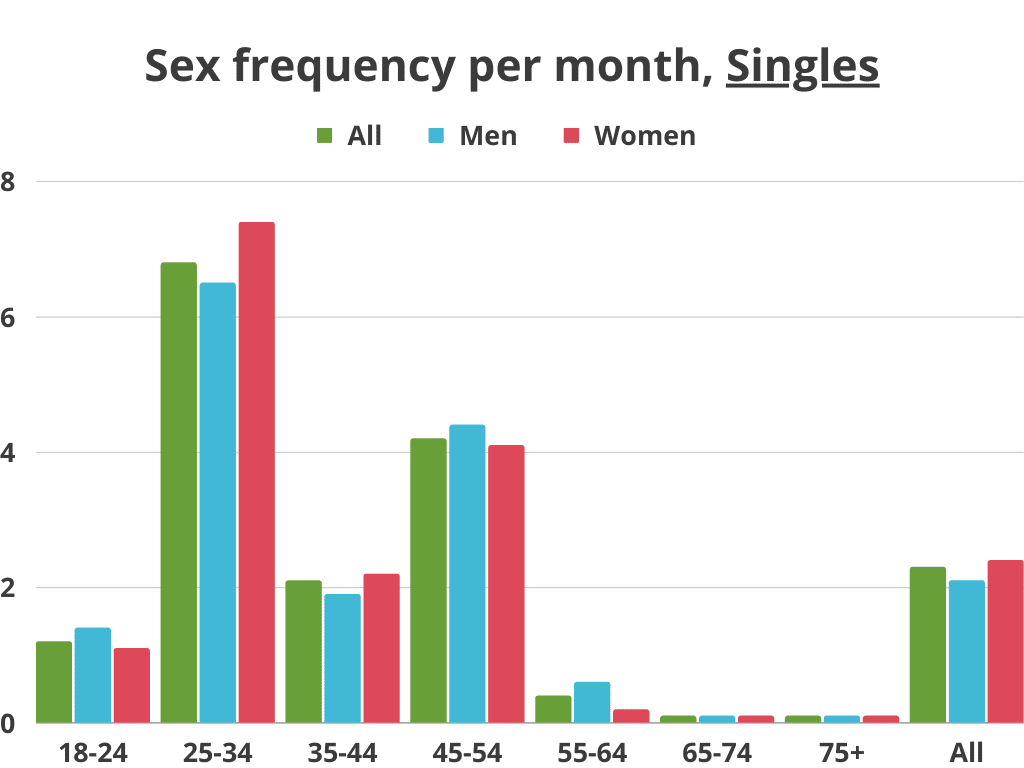
| Singles, by age groups | Frequency per month | | | Men | Women |
|---|---|---|---|---|
| 18-24 | 1.2 | | | 1.4 | 1.1 |
| 25-34 | 6.8 | | | 6.5 | 7.4 |
| 35-44 | 2.1 | | | 1.9 | 2.2 |
| 45-54 | 4.2 | | | 4.4 | 4.1 |
| 55-64 | 0.4 | | | 0.6 | 0.2 |
| 65-74 | 0.1 | | | 0.1 | 0.1 |
| 75+ | 0.1 | | | 0.1 | 0.1 |
| All | 2.2 | | | 2.1 | 2.4 |
Sex frequency, times per month (all couples), by age group
In the first statistical chart of sexual activity we included all intercourse recordings of couples (of all types). Then we averaged this number out on a full month.
Additionally we split the data up by age groups.
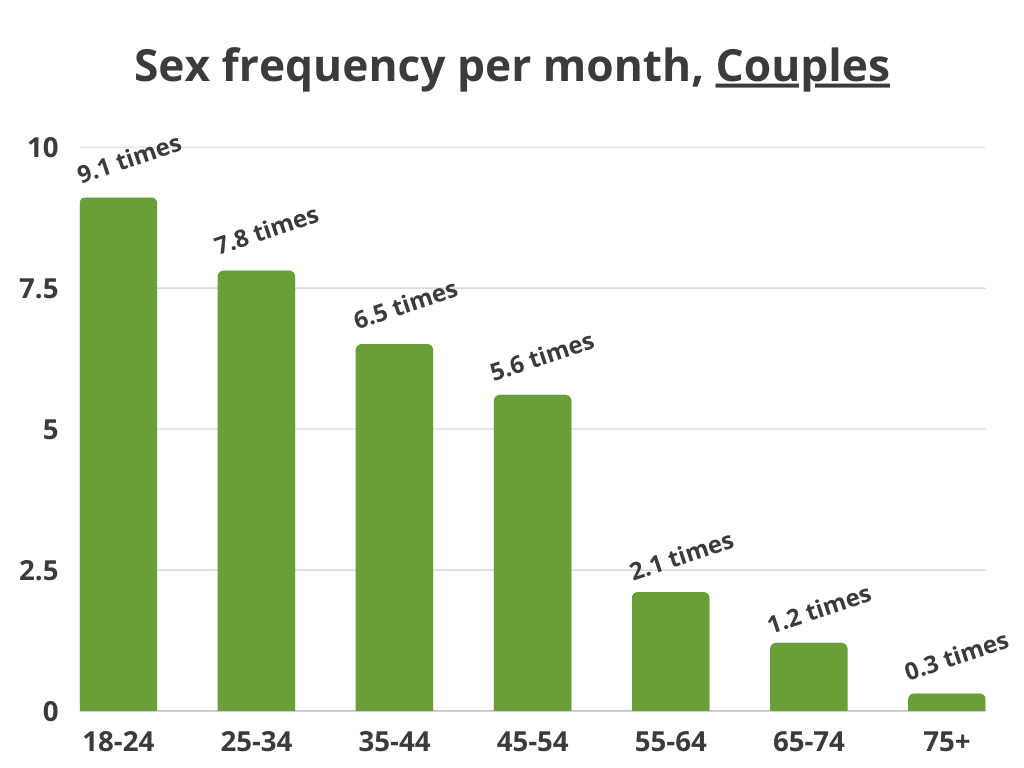
- On average couples have sex 1.4 times per week (5.8 times per month).
- Thew most sexually active couples are between 18 and 24, and they have sex 2.1 times per week on average.
- The least sexually active couples are 75+ who have sex on average every 3-4 months (0.3 times per month).
| Couples, by age groups | Sex frequency per month | Per week |
|---|---|---|
| 18-24 | 9.1 | 2.1 |
| 25-34 | 7.8 | 1.8 |
| 35-44 | 6.5 | 1.5 |
| 45-54 | 5.6 | 1.3 |
| 55-64 | 2.1 | 0.5 |
| 65-74 | 1.2 | 0.3 |
| 75+ | 0.3 | 0.1 |
| All | 5.8 | 1.4 |
What the data showed is that:
- Couples on average have sex 1.4 times per week.
- Couples aged 18-24 have sex on average 2.1 times per week.
- Couples aged 25-34 have sex on average 1.8 times per week.
- Couples aged 35-44 have sex on average 1.5 times per week.
- Couples aged 45-54 have sex on average 1.3 times per week.
- Couples aged 55-64 have sex on average 0.5 times per week.
- Couples aged 65-74 have sex on average 0.3 times per week.
- Couples aged 75+ have sex on average 0.1 times per week.
How often do Married couples have sex?
In this section we took at look at the difference between married and unmarried couples.
This allowed us to see, if there is a correlation between sex frequency and married status across different age groups.
What we found is that:
- Married couples on average have sex 5.9 times per month (1.4 times per week).
- Unmarried couples have sex on average 5.4 times per month.
- Married couples have sex on average 0.5 times more per month than unmarried couples.
- Unmarried couples over 40 years old have sex more frequently than married couples of similar age.
The last part of the statistics can be explained by the fact that after 40, unmarried couples are often also new couples where sex frequency is often higher than long-term couples.

| Couples, by age groups | Married, per month | Unmarried, per month | All |
|---|---|---|---|
| 18-24 | 10.9 | 7.1 | 9.1 |
| 25-34 | 8.6 | 6.2 | 7.8 |
| 35-44 | 5.8 | 7.2 | 6.5 |
| 45-54 | 5.1 | 6.8 | 5.6 |
| 55-64 | 1.7 | 3.1 | 2.1 |
| 65-74 | 1.1 | 2.3 | 1.2 |
| 75+ | 0.3 | 0.5 | 0.3 |
| All | 5.2 | 5.4 | 5.3 |
We have also added the same sex frequency chart for the weekly frequencies:
| Couples, by age groups | Married, per week | Unmarried, per week | All |
|---|---|---|---|
| 18-24 | 2.5 | 1.6 | 2.1 |
| 25-34 | 2.0 | 1.4 | 1.8 |
| 35-44 | 1.4 | 1.7 | 1.5 |
| 45-54 | 1.2 | 1.6 | 1.3 |
| 55-64 | 0.4 | 0.7 | 0.5 |
| 65-74 | 0.2 | 0.5 | 0.3 |
| 75+ | 0.1 | 0.1 | 0.1 |
| All | 1.2 | 1.3 | 1.2 |
What this shows is that:
- Unmarried couples have sex on average 1.3 times per week, while married couples only have sex 1.2 times per week.
- For couples aged 18-24: Unmarried couples have sex on average 1.6 times per week, while married couples only have sex 2.5 times per week.
- For couples aged 25-34: Unmarried couples have sex on average 1.4 times per week, while married couples only have sex 2.0 times per week.
- For couples aged 35-44: Unmarried couples have sex on average 1.7 times per week, while married couples only have sex 1.4 times per week.
- For couples aged 45-54: Unmarried couples have sex on average 1.6 times per week, while married couples only have sex 1.2 times per week.
- For couples aged 55-54: Unmarried couples have sex on average 0.7 times per week, while married couples only have sex 0.4 times per week.
- For couples aged 65-74: Unmarried couples have sex on average 0.5 times per week, while married couples only have sex 0.2 times per week.
- For couples aged 75+: Unmarried couples have sex on average 0.1 times per week, while married couples only have sex 0.1 times per week.
Sex frequency for couples per year
- The average American couple has sex 73 times per year.
- Couples younger than 34 years old has sex on average 103 times per year.
- Couples aged 18-24 years old has sex on average 109 times per year.
- Couples aged 25-34 years old has sex on average 94 times per year.
- Couples aged 35-44 years old has sex on average 78 times per year.
- Couples aged 45-54 years old has sex on average 68 times per year.
- Couples aged 55-64 years old has sex on average 26 times per year.
- Couples aged 65-74 years old has sex on average 16 times per year.
- Couples 75 years or older has sex on average 5-6 times per year.
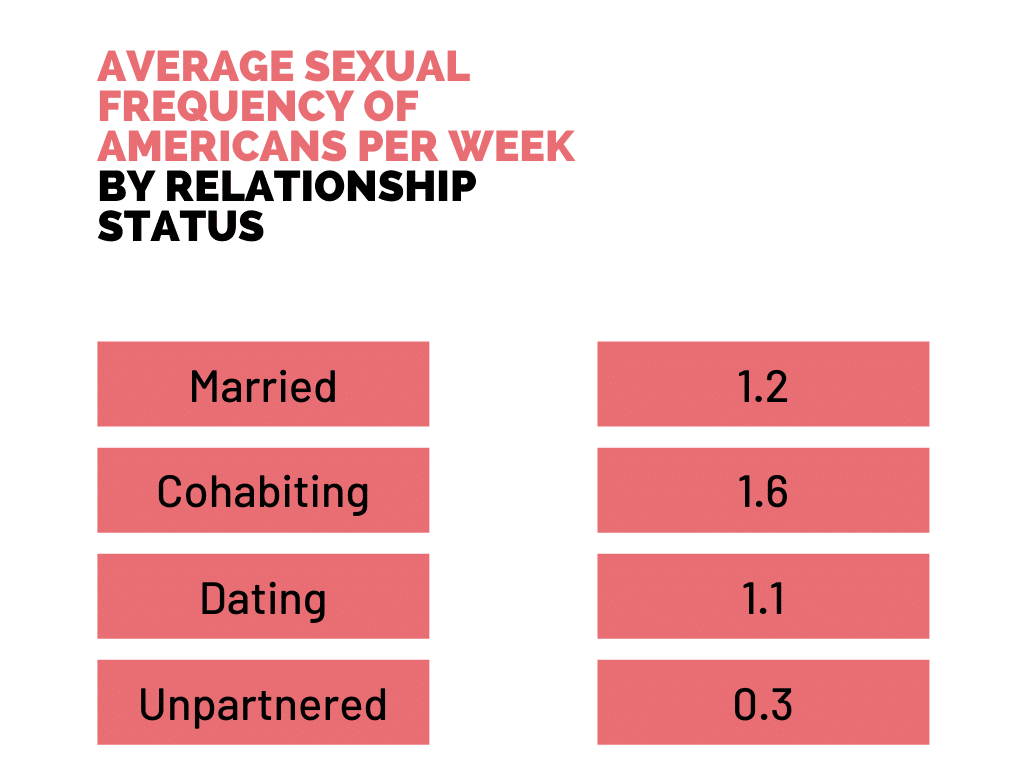
Statistics on the Average Sexual Frequency of Americans Per Week, by Relationship Status
- Married (1.2 times per week)
- Cohabiting couples (1.6 times per week)
- Dating (1.1 times per week)
- Unpartnered (0.3 times per week)
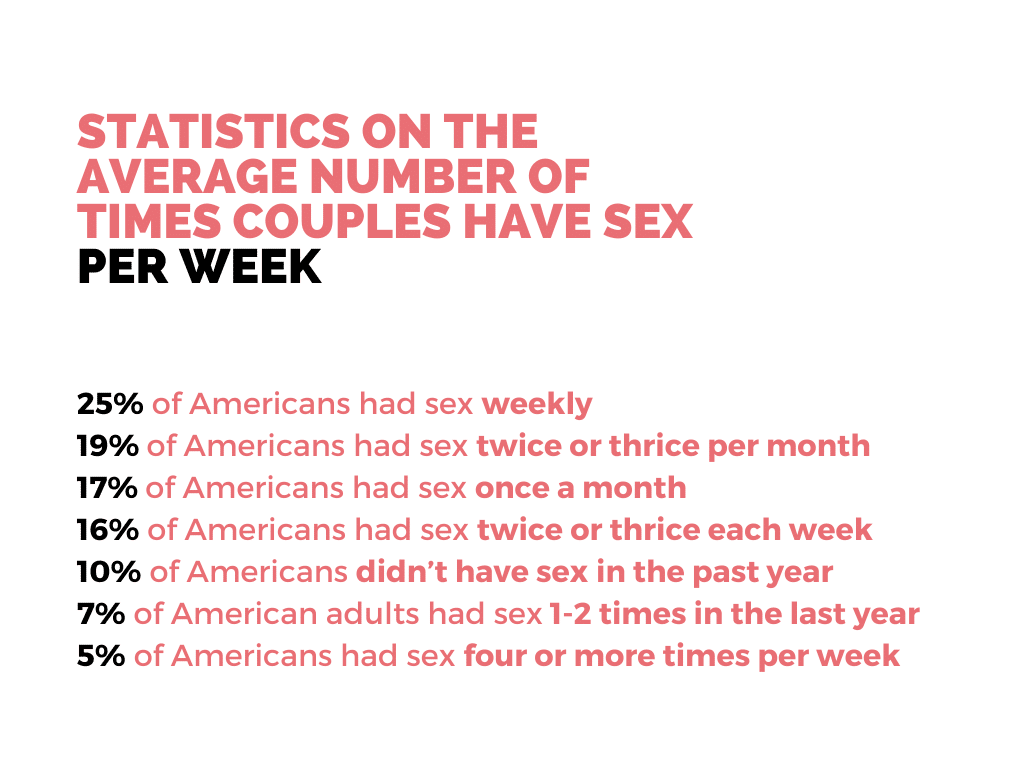
Statistics on the Average Number of Times Couples Have Sex Per Week
- 25% of Americans had sex weekly
- 19% of Americans had sex twice or thrice per month
- 17% of Americans had sex once a month
- 16% of Americans had sex twice or thrice each week
- 10% of Americans didn’t have sex in the past year
- 7% of American adults had sex 1-2 times in the last year
- 5% of Americans had sex four or more times per week
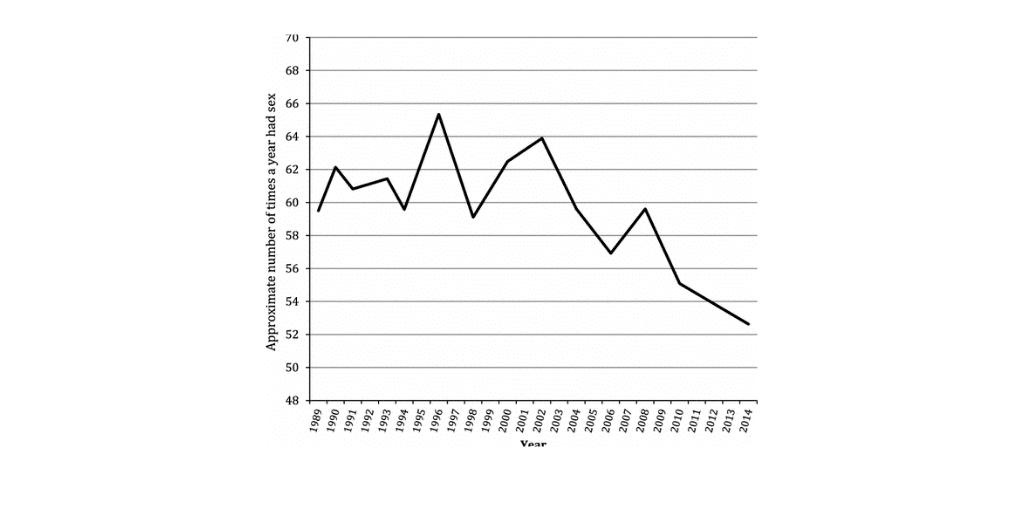
Statistics on the Estimated Times Per Year American Adults had Sex, 1989–2021
Americans have been found to have sex about nine fewer times per year in 2010 compared to the 1990s. It continues to decline until 2021, as shown in the figure below:
Statistics on the Sex Frequency of People Between Ages 50-80
- On average, people who are between 50-80 years old have sex two times a month
- 37% of individuals aged 50-80 were reported not having sex anymore
- 27% said that they had sex at least once per month
- 14% of the singles in the age group 50-80 said that they were down to have sex on the first date
- 30% of the singles in the same age group stated that they had sex within the first three dates
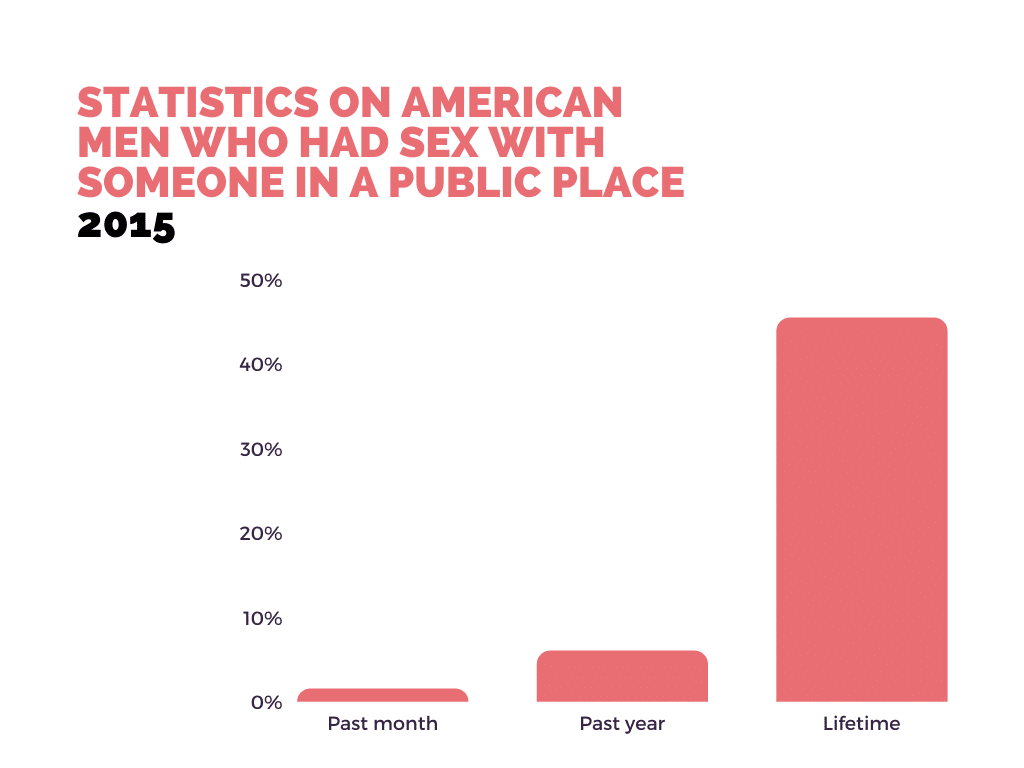
Statistics on American Men Who Had Sex with Someone in a Public Place
- 45.4% of American men had sex with someone in public in their lifetime
- 6% of American men had sex in public in the past year
- 1.5% stated that they had sex in public in the past month
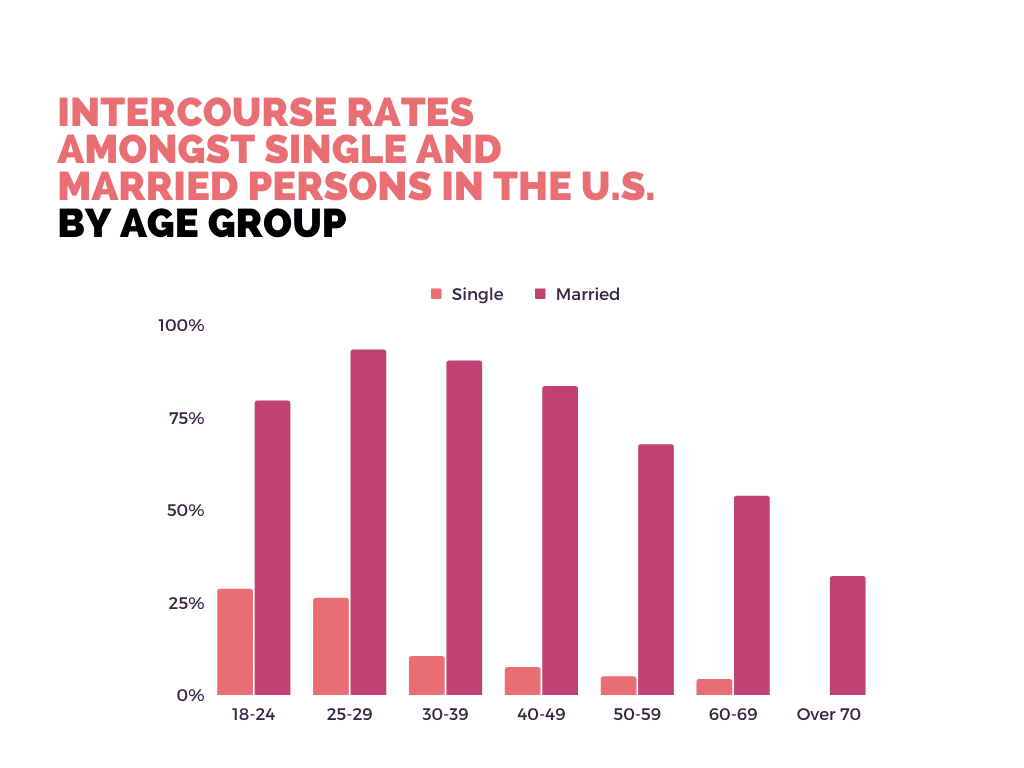
Statistics on the Intercourse Rates Amongst Single and Married Persons in the U.S. (by age group)
Married Couples
- 18-24 years old (79.4%)
- 25-29 years old (93.2%)
- 30-39 years old (90.2%)
- 40-49 years old (83.3%)
- 50-59 years old (67.6%)
- 60-69 years old (53.7%)
- Over 70 years old (31.9%)
Singles
- 18-24 years old (28.6%)
- 25-29 years old (26.2%)
- 30-39 years old (10.5%)
- 40-49 years old (7.5%)
- 50-59 years old (5%)
- 60-69 years old (4.3%)
- Over 70 years old (0%)
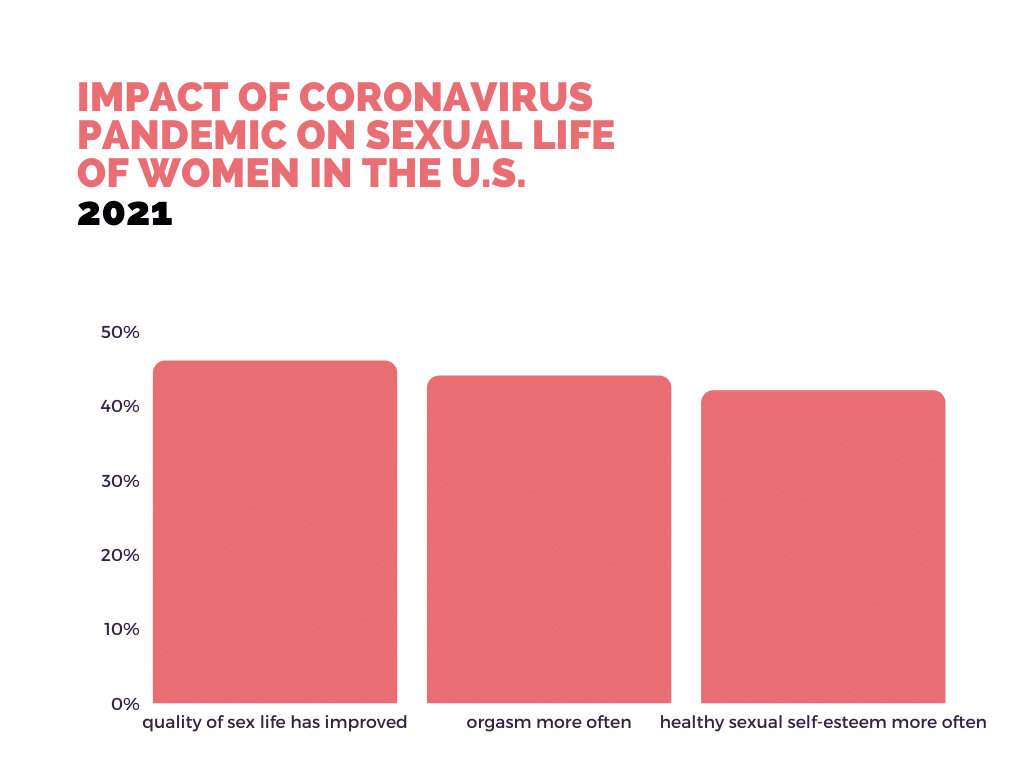
Statistics on the Impact of Coronavirus Pandemic on Sexual Life of Women in the U.S.
- 46% stated that their quality of sex life has improved
- 44% said that they had orgasms more often
- 42% revealed that they had healthy sexual self-esteem more often
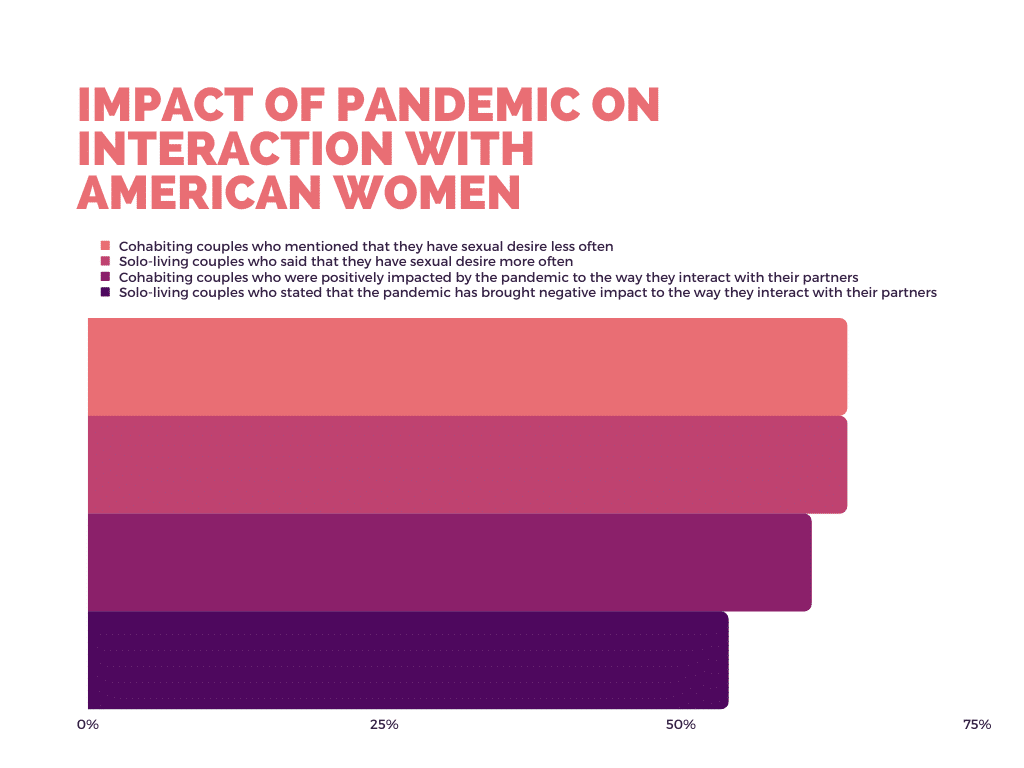
Statistics on the Impact of Pandemic on Interaction with American Women
- Cohabiting couples who mentioned that they have sexual desire less often (64%)
- Solo-living couples who said that they have sexual desire more often (64%)
- Cohabiting couples who were positively impacted by the pandemic to the way they interact with their partners (61%)
- Solo-living couples who stated that the pandemic has brought a negative impact on the way they interact with their partners (54%)
Factors Most Often Associated with the Frequency of Sexual Intercourse
- Age
- Time
- Parity
- Pregnancy
- Duration of Relationship
- Fertility Intentions
- Relationship Status
- Contraception
Common Reasons for Lack of Frequent Sex in Marriage
- Natural libido levels
- Age
- Health status of each partner
- The overall condition and quality of the relationship
Other Factors That May Affect Sex Life
- Stress
- Being busy with kids, career, and family
- Having a routine that becomes boring
- Lack of communication
- Changes in the body due to health conditions
- Not feeling heard or seen by the partner
Statistics on Married Sex and Satisfaction
- 96% of respondents said being emotionally connected results in the best sex
- 61% of women and 80% of men say “the sex is pretty good.”
- 90% believe it is possible for sex to get better after years of being together
- 2% are turned on by their partner, showing vulnerability
Ways on How to Have a Happy and Healthy Sex Life
Satisfying sex life can help improve the quality of your relationship. The following tips can aid in achieving a happy and healthy sex life:
- Have an open conversation with your partner.
- Feel free to make suggestions to your partner about your insights.
- Talk about what’s working and what’s not.
- Be honest in telling what you want.
- Be open to each other’s thoughts and ideas.
- Maintain physical affection.
- Experiment with different positions.
- Try self-help materials and other resources about improving your sex life.
You might be wondering how often should a couple have sex. If you’re satisfied and happy with the frequency of sex in your relationship, then you are having the proper amount of sex for yourself and your partner. But if you’re not, you should start discussing the problem. With the help of good communication and the intention to build a stronger relationship, you can come up with the right solutions, such as trying sex therapy and other experiments.
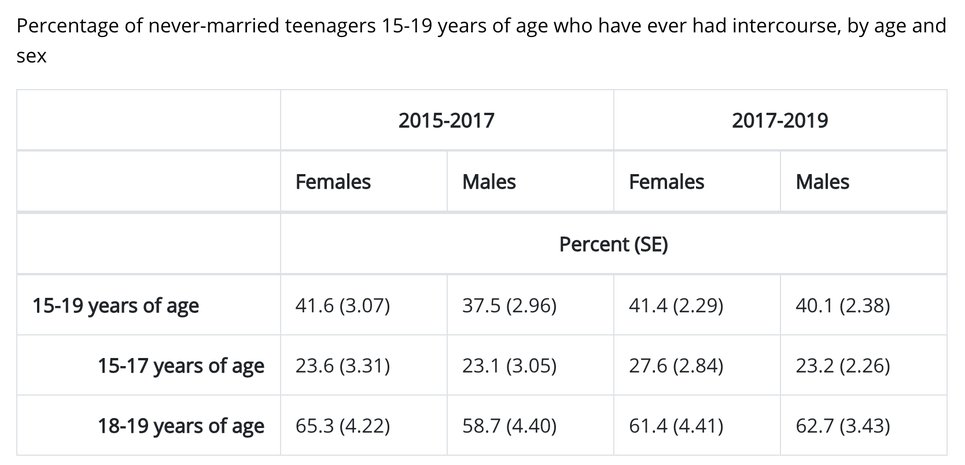
Teenagers and intercourse
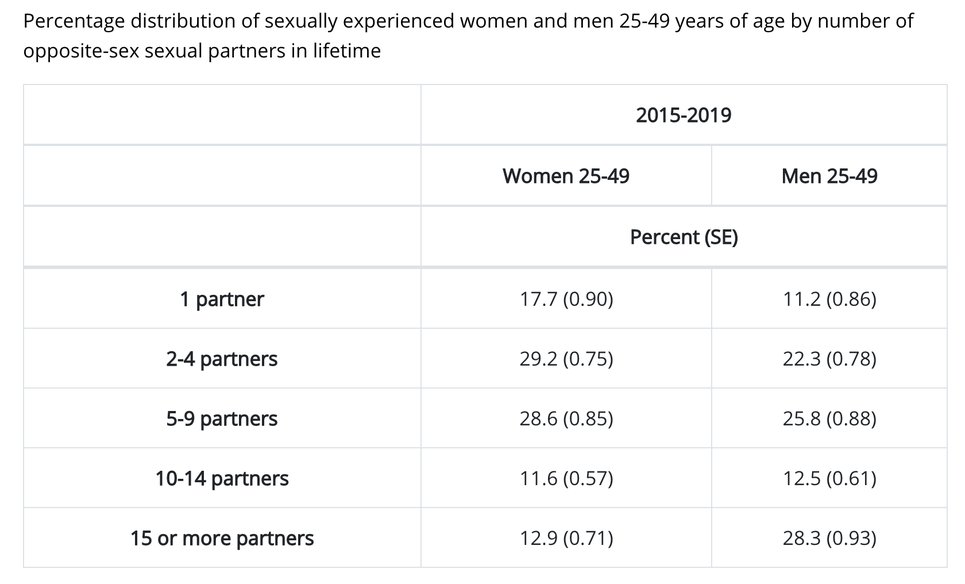
Number of sexual partners
The Percentage of Sexually Active Adults in the US
Sexual activity is an important aspect of adult life, and understanding the percentage of sexually active adults can provide insight into overall sexual health and behaviors. This section will explore the percentage of sexually active adults in the United States, both for men and women, using available statistics.
According to a study by the National Center for Health Statistics (NCHS) in 2017-2019, about 56% of adults aged 18-64 reported having had sexual intercourse in the past 12 months. The study found that men were more likely than women to have had sex in the past year, with 61% of men reporting sexual activity compared to 51% of women.
Age and Sexual Activity
As age increases, sexual activity tends to decrease. The same NCHS study found that among adults aged 18-24, 73% of men and 63% of women reported having had sex in the past year. Among adults aged 25-34, 71% of men and 61% of women reported sexual activity. For adults aged 35-44, the percentages were 66% for men and 55% for women, while for those aged 45-54, the percentages were 59% for men and 50% for women. Among adults aged 55-64, 45% of men and 32% of women reported having had sex in the past year.
Other Factors Affecting Sexual Activity
Other factors that may affect sexual activity include relationship status, education, and income. For example, according to a study by the University of Chicago, 71% of married adults reported having had sex in the past year, compared to 41% of unmarried adults. Additionally, individuals with higher levels of education and income are more likely to report sexual activity.
Comparison with Other Countries
While there are limited statistics available for sexual activity among adults in other countries, some studies have found differences between the US and other countries. For example, a study by the World Health Organization found that the percentage of sexually active adults in France, Germany, and the United Kingdom was higher than in the US. However, it is important to note that cultural and societal differences may play a role in these variations.
In conclusion, sexual activity is an important aspect of adult life, and understanding the percentage of sexually active adults can provide insight into overall sexual health and behaviors. In the US, about 56% of adults aged 18-64 reported having had sexual intercourse in the past year, with men more likely than women to report sexual activity. Age, relationship status, education, and income are among the factors that may affect sexual activity. While there are differences between the US and other countries, cultural and societal differences should also be taken into consideration.
Sex frequency and sex toys: A correlation?
In our sex toy usage statistics we covered a lot of ground and found that people who own sex toys more often have sex.
The correlation was found from both owning anal sex toys, a good vibrator and every other type of couple sex toy.
It didn’t matter if the person was single and bought a butt plug or a Fleshlight, or was in a comitted relationship and bought a cock ring, vibrating panties (or in a LDR and bought remote control sex toys)