


Transgender individuals have historically been a marginalized group, facing discrimination and prejudice in many areas of life. However, with increasing visibility and advocacy efforts, awareness of the unique challenges faced by this population is growing.
In this statistical report, we provide key data points related to transgender individuals, including demographics, healthcare access, and experiences, mental health, and employment. By shedding light on these important issues, we hope to further understand and support the transgender community.
We’ve gone over the following:
- What percentage of people are transgender?
- Violence against trans women and men
- Detransition
- Transgender HIV (STDs)
- Trans homelessness
- Transgender health and mental health
- Transgender suicide rate
- Transgender surgery
- Poverty
- Sources
Key Findings
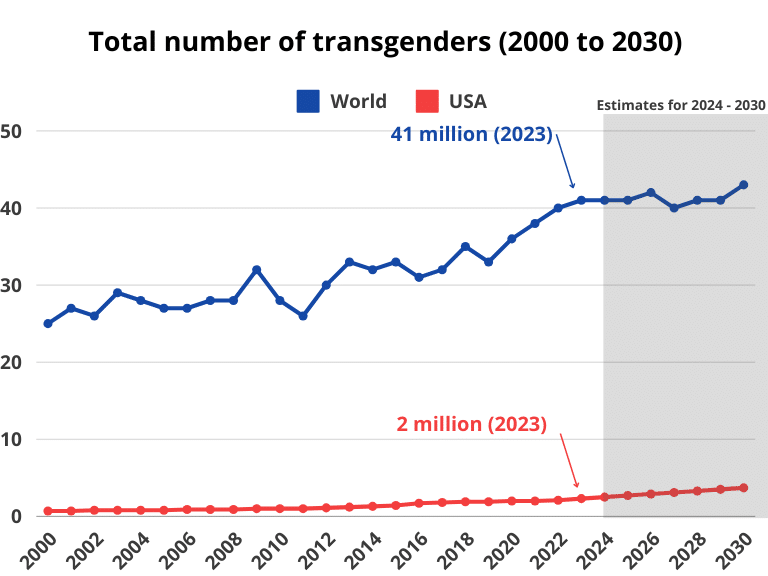
- 0.5% of the world’s population is transgender, that’s around 41 million people.
0.8% of the US population is transgender, that’s around 2 million Americans.
- 38.5% of transgenders are trans women.
35.9% of transgenders are trans men.
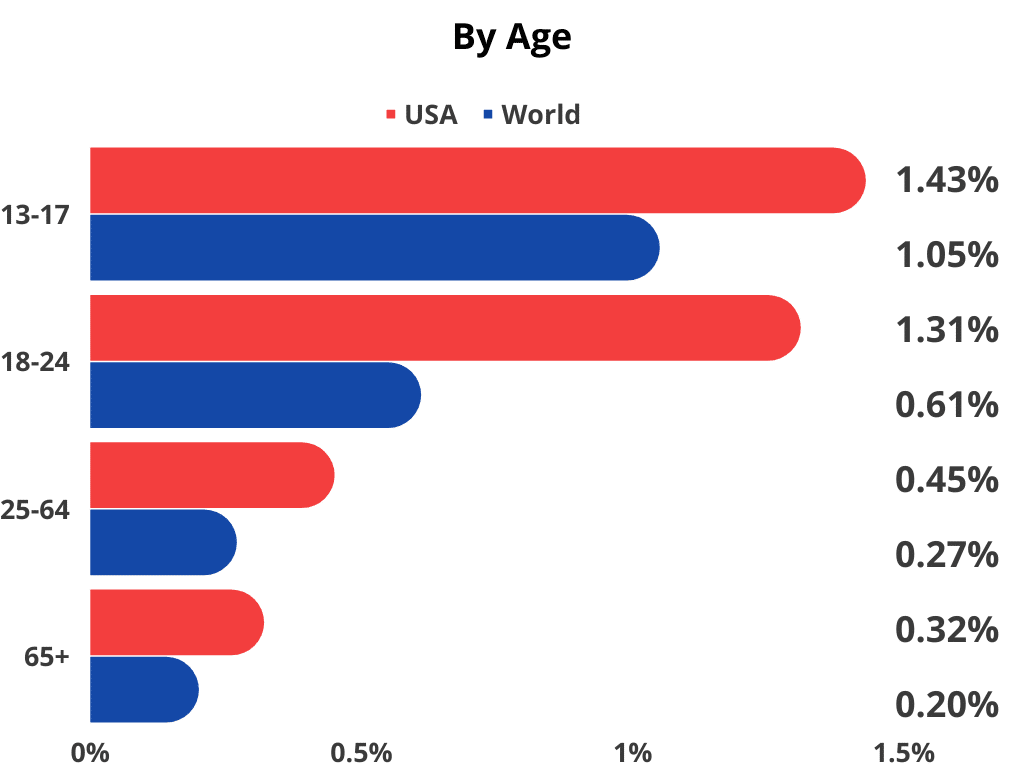
- Transgender by age:
1.05% of 13-17 years old are trans
0.61% of 18-24 years old are trans
0.27% of 25-64 years old are trans
0.2% of 65+ years old are trans
- The countries with the most transgenders are (More than 2% of the population are trans)
1) Germany
2) India
3) Spain
4) Brazil
5) Canada
6) Ukraine
7) Argentina
8) Russia
9) Spain
- The District of Columbia has the highest percentage of transgender individuals among adults at 2.03%
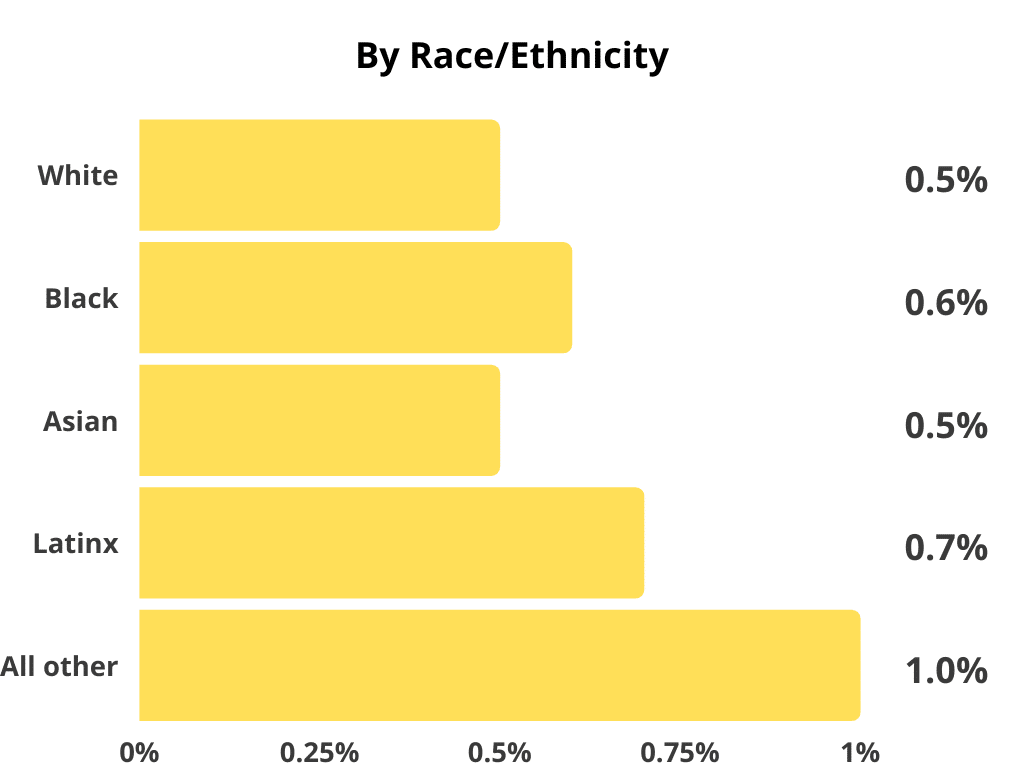
- 0.5% of whites are trans
0.6% of black are trans
0.5% of Asians are trans
0.7 of Latinx are trans
1.0% of all other races are trans
- 3 out of 10 transgenders have been fired from their job.
- 25% of transgenders have been in the military.
- 75% of students that are transgenders feel unsafe in school (in education).
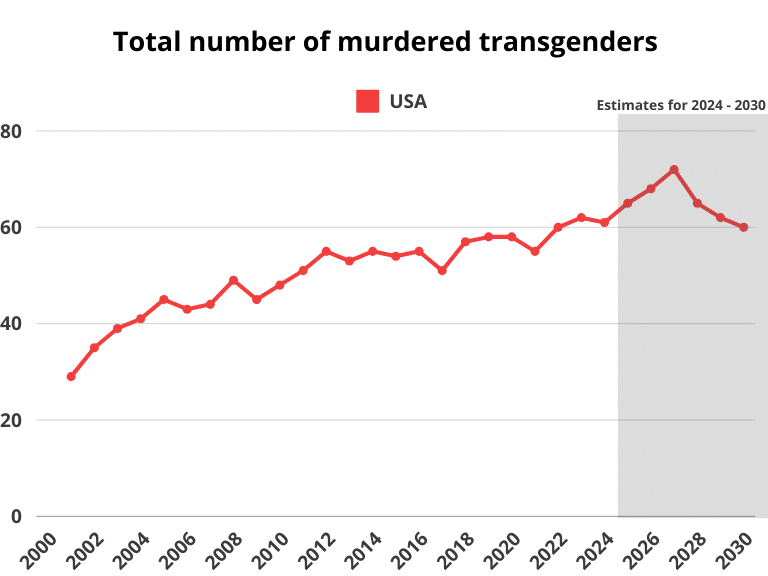
- A minimum of 60 transgender people were killed last year.
- 5 out of 10 trans were unable to vote in at least one election in their life.
- 47% of transgender people have been sexually assaulted.
- 80% of anti-transgender homicides in the United States are against transgender women of color.
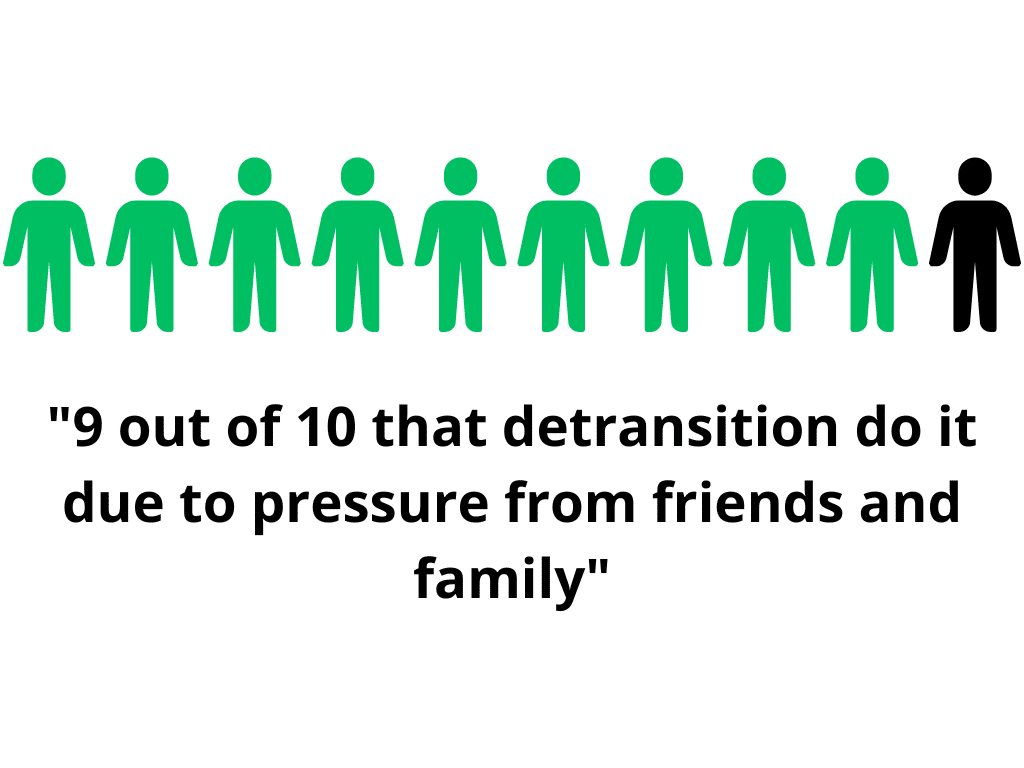
- 9 out of 10 that detransitioned did it due to external pressure from friends and family.
- 2 out of 10 transgenders have HIV worldwide.
- 1 out of 3 trans in D.C. is HIV-positive.
- 48% of transgenders have experience homelessness.
- 20% of transgenders do not have any health insurance.
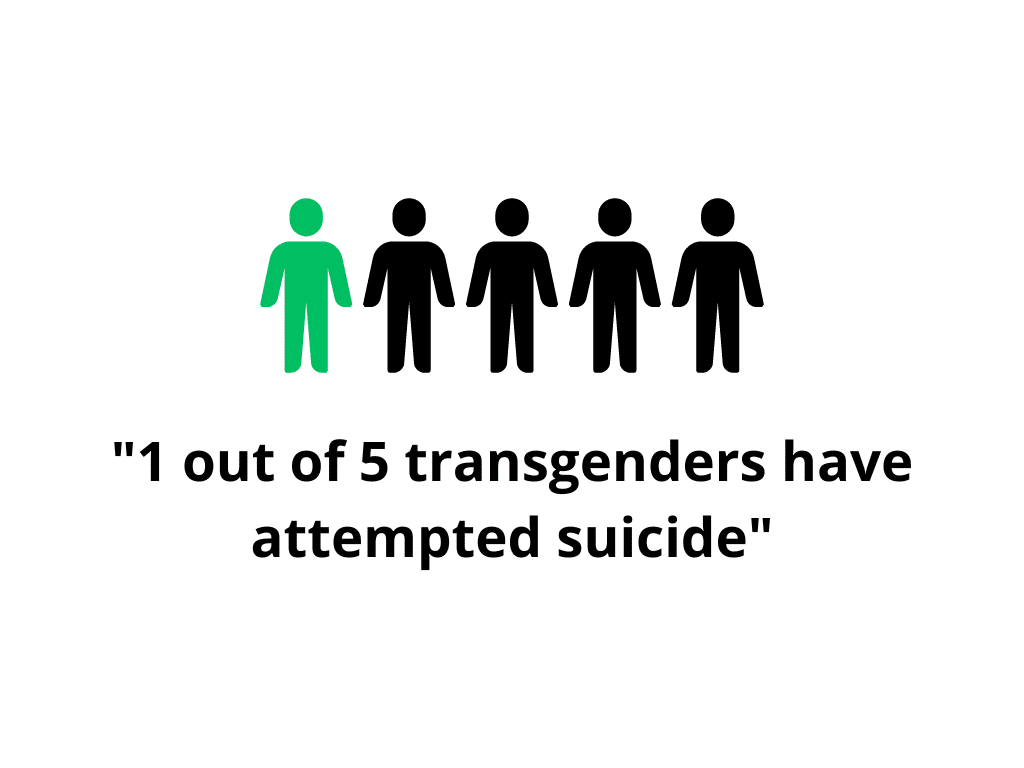
- 2 out of 5 trans have attempted suicide (it’s 2 out of 200 from the general population).
- 1 out of 5 transgenders gets a sex change surgery.
- 31% of trans adults are below the poverty line. The threshold was in the US $35,801 in 2022.
What percentage of people are transgender?
- 0.5% of the world’s population is transgender, that’s around 41 million people.
- 0.8% of the US population is transgender, that’s around 2 million Americans.
- 38.5% of transgenders are trans women.
35.9% of transgenders are trans men.
25.6% of transgenders are gender non-conforming. - 3 out of 10 persons know someone who is transgender.
By age (transgender kids, teens, and adults)
- USA by age:
13-17 (kids and teens): 1.43%
18-24 (adults): 1.31%
25-64 (adults): 0.45%
65+ (adults): 0.32% - Global by age:
13-17 (kids and teens): 1.05%
18-24 (adults): 0.61%
25-64 (adults): 0.27%
65+ (adults): 0.2%
By country
- What percentage of the US is trans? 0.42% are transgenders (18+) and 1.21% are transgenders (13-17) in the USA. Total average of 0.8%
- The highest percentages of transgender individuals are found in Germany, India, Spain, Brazil, Canada, Ukraine, Argentina, Russia, and Spain, all of which have a percentage of over 2.00%.
- China has a higher percentage of transgender individuals than the United States, which is surprising given that the United States is often seen as more accepting of LGBTQ+ individuals.
- Many of the countries on the list have a very low percentage of transgender individuals, which could be due to factors such as lack of legal recognition, discrimination, and social stigma.
- The list highlights the need for more accurate and comprehensive data on the transgender population, as many countries do not collect data on gender identity, and self-identification and legal recognition vary widely across different countries.
| No. | Country | Transgender in % of the population |
|---|---|---|
| 1 | China | 1.32% |
| 2 | India | 2.11% |
| 3 | United States | 0.80% |
| 4 | Indonesia | 0.10% |
| 5 | Pakistan | 0.05% |
| 6 | Brazil | 2.15% |
| 7 | Nigeria | 0.05% |
| 8 | Bangladesh | 0.10% |
| 9 | Russia | 2.18% |
| 10 | Japan | 0.42% |
| 11 | Mexico | 0.40% |
| 12 | Philippines | 0.10% |
| 13 | Egypt | 0.05% |
| 14 | Vietnam | 0.35% |
| 15 | Ethiopia | 0.05% |
| 16 | DR Congo | 0.05% |
| 17 | Turkey | 0.10% |
| 18 | Iran | 0.10% |
| 19 | Germany | 3.00% |
| 20 | Thailand | 0.20% |
| 21 | United Kingdom | 1.95% |
| 22 | France | 0.30% |
| 23 | Italy | 0.10% |
| 24 | Tanzania | 0.05% |
| 25 | South Africa | 0.80% |
| 26 | Myanmar | 0.10% |
| 27 | Kenya | 0.05% |
| 28 | South Korea | 0.10% |
| 29 | Colombia | 0.10% |
| 30 | Spain | 2.00% |
| 31 | Uganda | 0.05% |
| 32 | Argentina | 2.00% |
| 33 | Ukraine | 0.20% |
| 34 | Algeria | 0.05% |
| 35 | Sudan | 0.05% |
| 36 | Iraq | 0.05% |
| 37 | Afghanistan | 0.05% |
| 38 | Poland | 0.10% |
| 39 | Canada | 2.00% |
| 40 | Morocco | 0.10% |
| 41 | Saudi Arabia | 0.14% |
| 42 | Uzbekistan | 0.05% |
| 43 | Peru | 0.20% |
| 44 | Malaysia | 0.10% |
| 45 | Angola | 0.05% |
| 46 | Mozambique | 0.05% |
| 47 | Ghana | 0.09% |
| 48 | Yemen | 0.19% |
| 49 | Nepal | 0.07% |
| 50 | Venezuela | 0.20% |
By US state
- The District of Columbia has the highest percentage of transgender individuals among adults at 2.03%, followed by Hawaii and New Mexico at 0.57% and 0.55% respectively.
- California has the highest number of transgender individuals among adults at 218,400, which accounts for 0.54% of its adult population.
- The Midwest and the Plains states tend to have lower percentages of transgender individuals, with North Dakota having the lowest percentage at 0.2%.
- The percentage of transgender individuals among adults is generally higher in states that are more liberal and have more LGBTQ-friendly policies.
| State | Transgender Population (18+) | Transgender Population (per 100k) | Transgender Population (in %) |
|---|---|---|---|
| District of Columbia | 14,550 | 2,032 | 2.03% |
| Hawaii | 8,450 | 569 | 0.57% |
| New Mexico | 11,750 | 550 | 0.55% |
| California | 218,400 | 543 | 0.54% |
| Georgia | 55,650 | 505 | 0.51% |
| Vermont | 3,000 | 463 | 0.46% |
| Mississippi | 13,650 | 461 | 0.46% |
| Oklahoma | 18,350 | 456 | 0.46% |
| Oregon | 19,750 | 453 | 0.45% |
| Florida | 100,300 | 449 | 0.45% |
| Delaware | 4,550 | 447 | 0.45% |
| Louisiana | 20,900 | 445 | 0.45% |
| Alabama | 22,500 | 441 | 0.44% |
| Arkansas | 13,400 | 441 | 0.44% |
| Tennessee | 31,200 | 441 | 0.44% |
| North Carolina | 44,750 | 418 | 0.42% |
| Massachusetts | 29,900 | 417 | 0.42% |
| Minnesota | 24,250 | 416 | 0.42% |
| Arizona | 30,550 | 414 | 0.41% |
| Texas | 125,350 | 413 | 0.41% |
| Washington | 32,850 | 411 | 0.41% |
| Missouri | 25,050 | 404 | 0.4% |
| Indiana | 27,600 | 401 | 0.4% |
| South Carolina | 21,000 | 399 | 0.4% |
| Nevada | 12,700 | 394 | 0.39% |
| Virginia | 34,500 | 391 | 0.39% |
| Maine | 5,350 | 390 | 0.39% |
| Kentucky | 17,700 | 389 | 0.39% |
| Illinois | 49,750 | 388 | 0.39% |
| New York | 78,600 | 384 | 0.38% |
| Rhode Island | 4,250 | 383 | 0.38% |
| Alaska | 2,700 | 365 | 0.36% |
| Maryland | 22,300 | 354 | 0.35% |
| Colorado | 20,850 | 348 | 0.35% |
| West Virginia | 6,100 | 343 | 0.34% |
| Connecticut | 12,400 | 343 | 0.34% |
| Ohio | 39,950 | 336 | 0.34% |
| Pennsylvania | 43,800 | 335 | 0.33% |
| Michigan | 32,900 | 325 | 0.32% |
| New Hampshire | 4,500 | 322 | 0.32% |
| Wisconsin | 19,150 | 322 | 0.32% |
| New Jersey | 30,100 | 319 | 0.32% |
| Kansas | 9,300 | 314 | 0.31% |
| Nebraska | 5,400 | 270 | 0.27% |
| Idaho | 4,750 | 247 | 0.25% |
| Montana | 2,700 | 243 | 0.24% |
| Wyoming | 1,400 | 241 | 0.24% |
| South Dakota | 2,150 | 237 | 0.24% |
| Iowa | 7,400 | 229 | 0.23% |
| Utah | 7,200 | 210 | 0.21% |
| North Dakota | 1,650 | 203 | 0.2% |
By race/ethnicity
- Percentage of races that are transgender:
White trans: 0.5%
Black trans: 0.6%
Asian trans: 0.5%
Latinx trans: 0.7%
All other races: 1.0%
By gender identity and race
- The majority of individuals identifying as male-to-female are White (50.6%) and the smallest percentage is Asian/Pacific Islander (2.4%).
- The majority of individuals identifying as female-to-male are also White (59.8%) and the smallest percentage is Asian/Pacific Islander (1.6%).
- The majority of individuals identifying as nonbinary are White (55.2%) and the smallest percentage is Asian/Pacific Islander (2.1%).
- Across all gender identities, White individuals make up the largest percentage of those surveyed (ranging from 50.6% to 59.8%) followed by Black individuals (ranging from 14.5% to 17.7%). Latinx individuals make up the third-largest group, ranging from 19.2% to 24.2%.
- The “Other/Mixed Race” category makes up between 4.9% and 5.5% of all individuals across gender identities.
| Gender Identity | White | Black | Latinx | Asian/Pacific Islander | Other/Mixed Race | Total |
|---|---|---|---|---|---|---|
| Male-to-Female | 50.6% | 17.7% | 24.2% | 2.4% | 4.9% | 100.0% |
| Female-to-Male | 59.8% | 14.5% | 19.2% | 1.6% | 4.9% | 100.0% |
| Nonbinary | 55.2% | 16.6% | 20.7% | 2.1% | 5.5% | 100.0% |
| Total | 54.5% | 16.4% | 22.0% | 2.1% | 5.0% | 100.0% |
By Job
- 29% of transgender individuals have experienced discrimination or mistreatment in the workplace due to their gender identity, such as being fired or denied a promotion.
- 16% of transgender individuals have experienced unemployment, which is twice the national average at the time of the survey.
- Transgender individuals are overrepresented in certain fields, including the entertainment industry and sex work.
- Transgender individuals are underrepresented in certain fields, such as science and technology.
- Transgender individuals are more likely to work in jobs that provide lower wages, fewer benefits, and less job security compared to the general population.
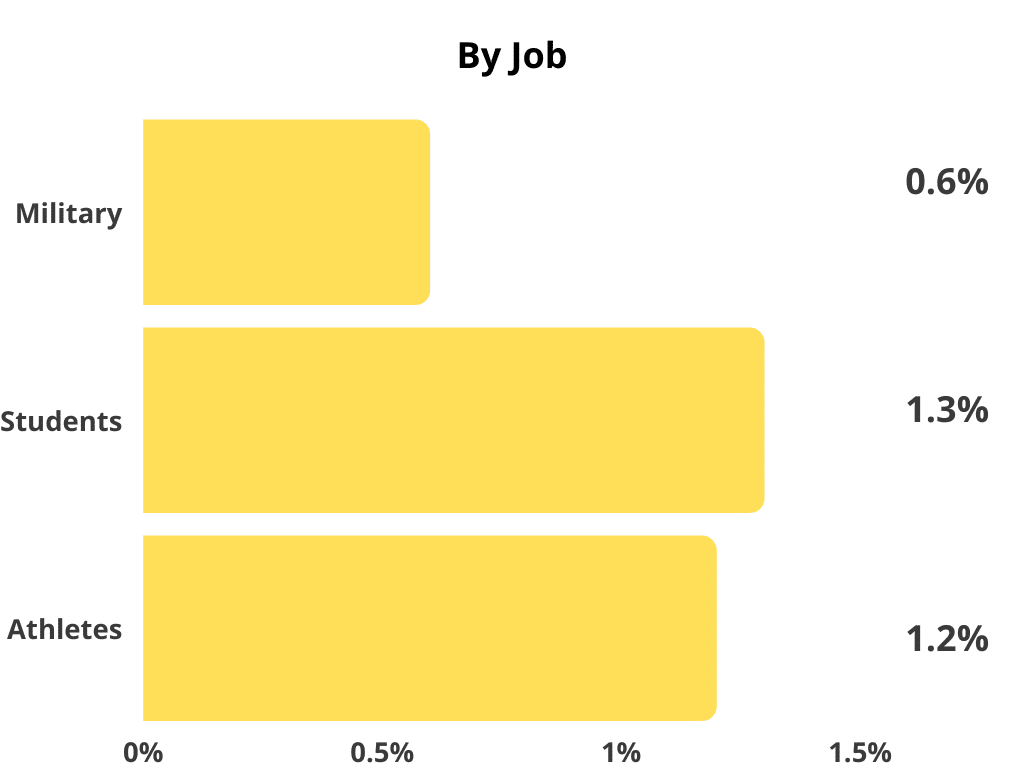
- 75% of students that are transgenders feel unsafe in school (in education).
- 1.3% of students are transgender.
- 25% of transgenders have been in the military.
- 0.6% of the armed forces (the military) are transgender.
- 1.2% of athletes are trans.
- 3 out of 10 transgenders have been fired from their job.
Violence against trans women and men
- At least 61 transgender people were killed in 2023, making it the deadliest year on record for transgender and gender non-conforming people.
- 80% of anti-transgender homicides in the United States are against transgender women of color.
- 54% have experienced some form of intimate partner violence.
- 47% of transgender people have been sexually assaulted at some point in their lifetime. Meaning they are at higher risk of rape than other segments. Only 3 out of 10 reported the sexual assault to the police.
- 29% of transgender individuals postponed or avoided medical care due to fear of discrimination.
- 33% reported experiencing at least one negative experience, such as being refused treatment or being verbally or physically harassed.
- 5 out of 10 trans were unable to vote in at least one election in their life.
Detransition
- 96% of those who transition are happy, and only 4% are dissatisfied.
- 1.75% of transgenders detransition back to the gender they came from.
- 9 out of 10 that detransitioned did it due to external pressure from friends and family.
Transgender HIV (STDs)
- Transgender women are 50 times more likely to get HIV.
- 2 out of 10 transgenders have HIV worldwide.
- 1 out of 3 trans in D.C. is HIV-positive.
- 8 out of 10 transgender women have been tested for HIV throughout their life.
- 2% of all HIV diagnoses in the US were among trans people.
- 25-34 years old is the age when most trans are tested positive for HIV.
Trans homelessness
- 48% of transgenders have experience homelessness.
Transgender health and mental health
- 20% of transgenders do not have any health insurance.
- 34% of transgenders of color do not have any health insurance.
- 3 out of 10 transgenders have been refused health care by their doctor due to their gender identity.
- 80% of trans feel anxious, nervous, and/or depressed every week (only 5% of the general population does that).
Transgender suicide rate
- 2 out of 5 trans have attempted suicide – that’s 20% (it’s 2 out of 200 from the general population).
Transgender surgery
- 1 out of 5 transgenders gets a sex change surgery.
- Gender-affirming surgeries are performed in approximately 10.9% of medical encounters related to transsexualism.
- Complication rates for certain procedures, such as double flap phalloplasty in transgender men, can be as high as 53%.
- By the age of 7, around 78% of transgender males have experienced gender dysphoria.
- 41% of the ones that got surgery have reduced stress symptoms.
- 48% had reduced suicidal thoughts.
- 8 out of 10 were able to get an orgasm after surgery.
Poverty
- 31% of trans adults are below the poverty line. The threshold was in the US $35,801 in 2023.
Sources
- Badgett, M. V. L., Choi, S. K., & Wilson, B. D. M., (2019). LGBT poverty in the United States: A study of differences between sexual orientation and gender identity groups. Los Angeles, CA: The Williams Institute.
- Becasen, J. S., Denard, C. L., Mullins, M. M., Higa, D. H., & Sipe, T. A. (2019). Estimating the prevalence of HIV and sexual behaviors among the US transgender population: a systematic review and meta-analysis, 2006–2017. American journal of public health, 109(1), e1-e8.
- Bouman, W. P., Claes, L., Brewin, N., Crawford, J. R., Millet, N., Fernandez-Aranda, F., & Arcelus, J. (2017). Transgender and anxiety: A comparative study between transgender people and the general population. International Journal of Transgenderism, 18(1), 16-26.
- Bradford, J., Reisner, S. L., Honnold, J. A., & Xavier, J. (2013). Experiences of transgender-related discrimination and implications for health: results from the Virginia Transgender Health Initiative Study. American journal of public health, 103(10), 1820-1829.
- Clements-Nolle, K., Marx, R., Guzman, R., & Katz, M. (2001). HIV prevalence, risk behaviors, health care use, and mental health status of transgender persons: implications for public health intervention. American journal of public health, 91(6), 915.
- Collin, L., Reisner, S. L., Tangpricha, V., & Goodman, M. (2016). Prevalence of transgender depends on the “case” definition: a systematic review. The journal of sexual medicine, 13(4), 613-626.
- Connolly, D., & Gilchrist, G. (2020). Prevalence and correlates of substance use among transgender adults: A systematic review. Addictive behaviors, 111, 106544.
- Downing, J. M., & Przedworski, J. M. (2018). Health of transgender adults in the US, 2014–2016. American journal of preventive medicine, 55(3), 336-344.
- Downing, J. M., & Przedworski, J. M. (2018). Health of transgender adults in the US, 2014–2016. American journal of preventive medicine, 55(3), 336-344.
- Eckenrode, H. E., Gutierrez, O. M., Osis, G., Agarwal, A., & Curtis, L. M. (2022). Kidney disease prevalence in transgender individuals. Clinical Journal of the American Society of Nephrology, 17(2), 280-282.
- Flores, A.R., Herman, J.L., Gates, G.J., & Brown, T.N.T. (2016). How Many Adults Identify as Transgender in the United States? Los Angeles, CA: The Williams Institute.
- Gates, G. J., & Herman, J. (2014). Transgender military service in the United States.
- Gates, G. J. (2017). “Vermont Leads States in LGBT Identification”. State of the States. Gallup Politics.
- Grossman, A. H., & D’Augelli, A. R. (2007). Transgender youth and life-threatening behaviors. Suicide and life-threatening behavior, 37(5), 527-537.
- Herbst, J. H., Jacobs, E. D., Finlayson, T. J., McKleroy, V. S., Neumann, M. S., Crepaz, N., & HIV/AIDS Prevention Research Synthesis Team. (2008). Estimating HIV prevalence and risk behaviors of transgender persons in the United States: a systematic review. AIDS and Behavior, 12, 1-17.
- Herman, J.L., Flores, A.R., O’Neill, K.K. (2022). How Many Adults and Youth Identify as Transgender in the United States? The Williams Institute, UCLA School of Law
- Lombardi, E. (2009). Varieties of transgender/transsexual lives and their relationship with transphobia. Journal of homosexuality, 56(8), 977-992.
- Maguen, S., Shipherd, J. C., Harris, H. N., & Welch, L. P. (2007). Prevalence and predictors of disclosure of transgender identity. International Journal of Sexual Health, 19(1), 3-13.
- Meier, S. C., & Labuski, C. M. (2013). The demographics of the transgender population. International handbook on the demography of sexuality, 289-327.
- Millet, N., Longworth, J., & Arcelus, J. (2017). Prevalence of anxiety symptoms and disorders in the transgender population: A systematic review of the literature. International Journal of Transgenderism, 18(1), 27-38.
- Newfield, E., Hart, S., Dibble, S., & Kohler, L. (2006). Female-to-male transgender quality of life. Quality of life Research, 15, 1447-1457.
- Peitzmeier, S. M., Malik, M., Kattari, S. K., Marrow, E., Stephenson, R., Agénor, M., & Reisner, S. L. (2020). Intimate partner violence in transgender populations: Systematic review and meta-analysis of prevalence and correlates. American journal of public health, 110(9), e1-e14.
- Rotondi, N. K., Bauer, G. R., Scanlon, K., Kaay, M., Travers, R., & Travers, A. (2012). Prevalence of and risk and protective factors for depression in female-to-male transgender Ontarians: Trans PULSE Project. Canadian Journal of Community Mental Health, 30(2), 135-155.
- Ruppert, R., Kattari, S. K., & Sussman, S. (2021). Prevalence of Addictions among Transgender and Gender Diverse Subgroups. International Journal of Environmental Research and Public Health, 18(16), 8843.
- Stotzer, R. L. (2009). Violence against transgender people: A review of United States data. Aggression and Violent Behavior, 14(3), 170-179.
- Stryker, S. (2013). (De) subjugated knowledges: An introduction to transgender studies. In The transgender studies reader (pp. 1-17). Routledge.
- Stryker, S. (2017). Transgender history: The roots of today’s revolution. Hachette UK.
- Stryker, S., & Whittle, S. (Eds.). (2013). The transgender studies reader. Routledge.
- Testa, R. J., Sciacca, L. M., Wang, F., Hendricks, M. L., Goldblum, P., Bradford, J., & Bongar, B. (2012). Effects of violence on transgender people. Professional Psychology: Research and Practice, 43(5), 452.
- Van Gerwen, O. T., Jani, A., Long, D. M., Austin, E. L., Musgrove, K., & Muzny, C. A. (2020). Prevalence of sexually transmitted infections and human immunodeficiency virus in transgender persons: a systematic review. Transgender Health, 5(2), 90-103.
- Vidal‐Ortiz, S. (2008). Transgender and transsexual studies: Sociology’s influence and future steps. Sociology Compass, 2(2), 433-450.