

![Average Number of Sexual Partners [Statistics]](https://wp.bedbible.com/wp-content/uploads/2024/05/Average-Number-of-Sexual-Partners-Statistics.png)
Curious about how many sexual partners people typically have? Our report provides a comprehensive look at this intriguing topic. We break down the data by age, gender, and generation, both over a lifetime and in the past 12 months. You’ll also find insights based on different times when the data was collected and comparisons across various countries.
Dive into these statistics to better understand the patterns and trends in sexual behavior worldwide.
Table of contents:
- By Age
- By Gender and Generation (all time)
- By Gender and Generation (past 12 months)
- By Age and Gender (when asked at different times in the dataset)
- By Country
Key Findings
- The global average number of sexual partners is 9.
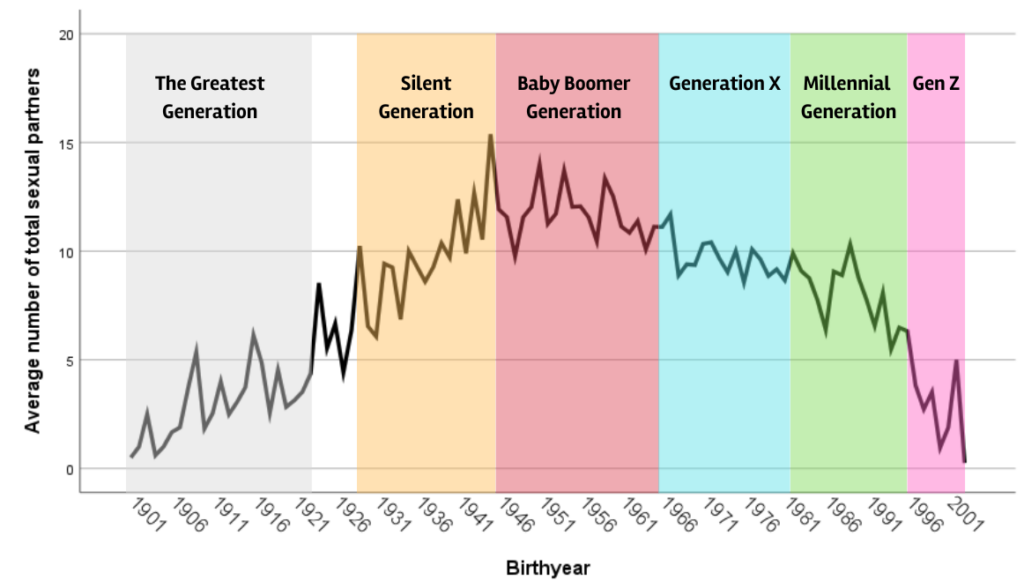
- The baby boomer generation was the most promiscuous with 12 different sexual partners on average.
- In the past 12 months, the Millennial generation was the most sexually active with over 2 different sexual partners on average.
- Women report on average to have 68% fewer different sexual partners in their lifetime.
- Men have on average 16.51 different sexual partners while women have 6.79 different sexual partners in their lifetime
- By age 20 women report to have been with 5.1 different sexual partners on average.
- By age 30 women report to have been with 6.2 different sexual partners on average.
- By age 20 men report to have been with 7.9 different sexual partners on average.
- By age 30 men report to have been with 11.3 different sexual partners on average.
- 5.4% of men have been with over 40 different sexual partners (over 500.000 men)
- 1.8% of women report having been with over 40 sexual partners.
- By country, top 5 countries:
- Turkey – with 14.5 average sexual partners at the age of 25-44
- Australia – with 13.2 average sexual partners at the age of 25-44
- New Zealand – with 13.2 average sexual partners at the age of 25-44
- Iceland – with 13.0 average sexual partners at the age of 25-44
- South Africa – with 12.5 average sexual partners at the age of 25-44
By Age
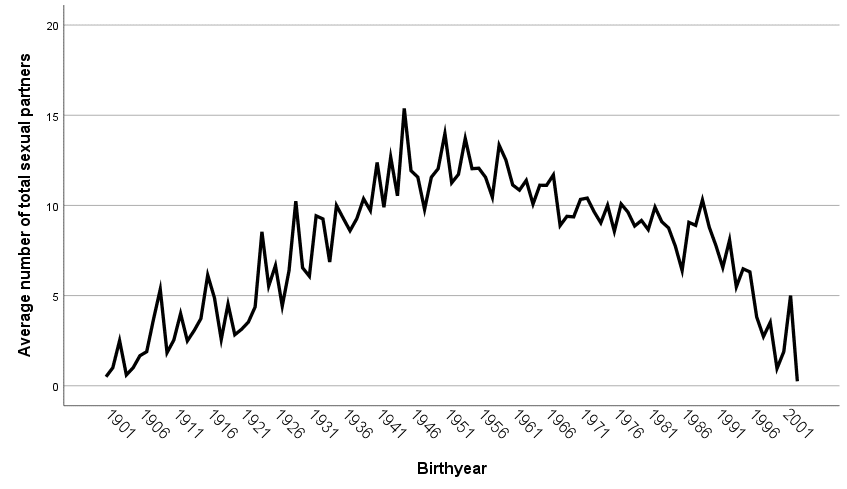
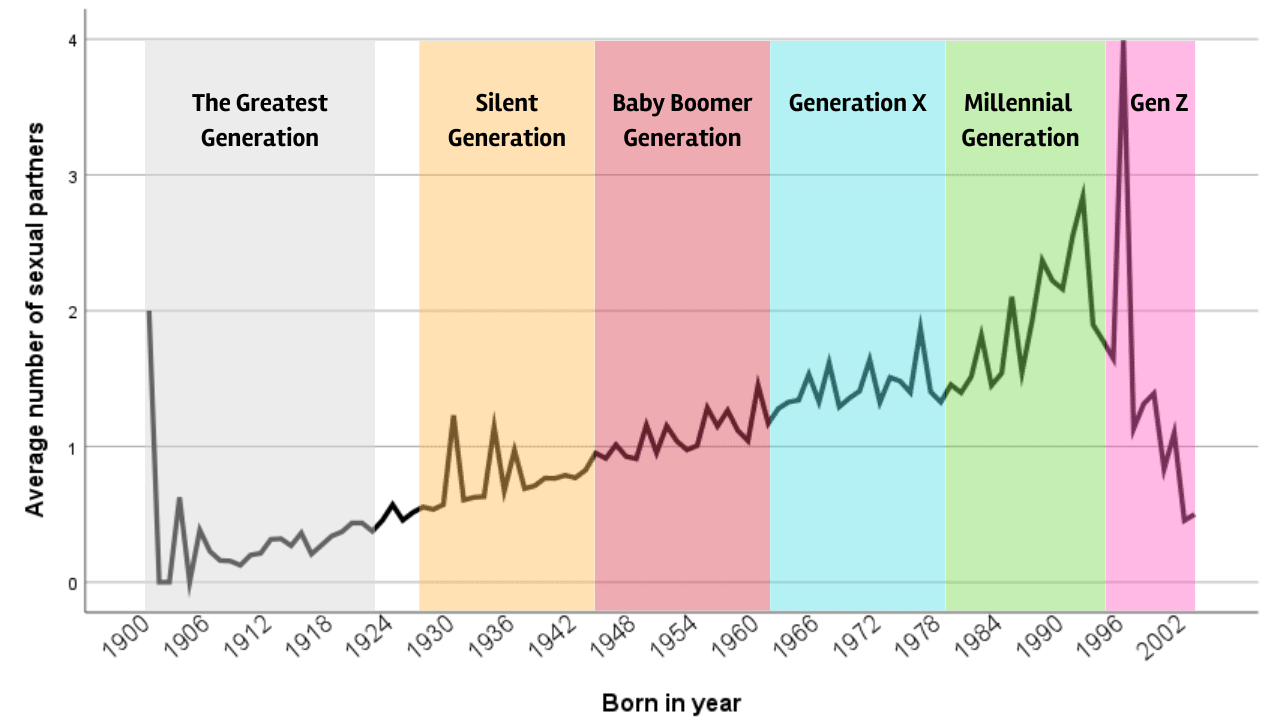
With the available dataset, we ran an analysis based on birth year. From the below graphs (and the tabulated table) we can conclude that the earlier you are born, the more likely you are to report having more sexual partners.
From this data, we could find some more tangible insights into how many sexual partners men and women have had by the time they turned 20, 30, 40, and more.
Average body count by age and gender
This is what we found when looking at women of different ages:
- By age 20 women report to have been with 5.1 different sexual partners on average.
- By age 30 women report to have been with 6.2 different sexual partners on average.
- By age 40 women report to have been with 6.1 different sexual partners on average.
- By age 60 women report to have been with 6.3 different sexual partners on average.
This is what we found when looking at men of different ages:
- By age 20 men report to have been with 7.9 different sexual partners on average.
- By age 30 men report to have been with 11.3 different sexual partners on average.
- By age 40 men report to have been with 14.1 different sexual partners on average.
- By age 60 men report to have been with 16.2 different sexual partners on average.
| Average number of sex partners… | All | Men | Women |
|---|---|---|---|
| by age 20 | 6.5 | 7.9 | 5.1 |
| by age 30 | 8.8 | 11.3 | 6.2 |
| by age 40 | 10.1 | 14.1 | 6.1 |
| by age 60 | 11.3 | 16.2 | 6.3 |
Average number of sexual partners (all time), By Age/birth
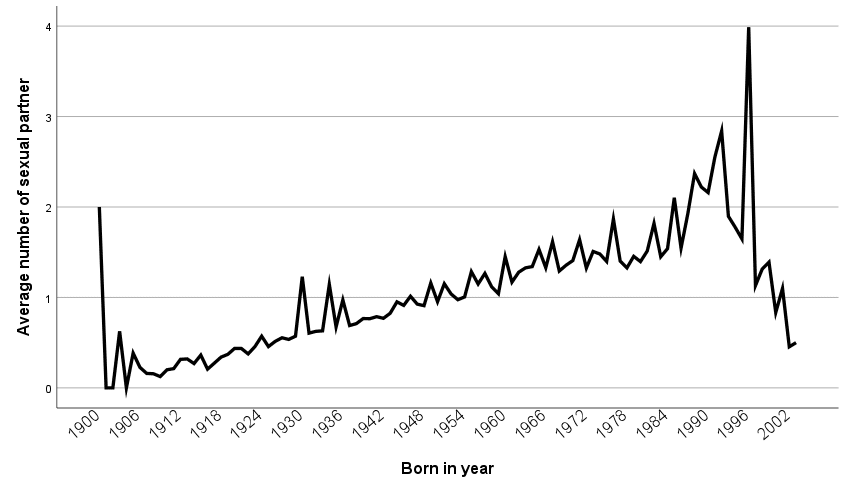
Average number of sexual partners (last 12 months), By Age/Birthyear
Younger people have on average had more sexual partners than older people in the past 12 months.
This tendency breaks at people around 25 years old, where the average number of sexual partners falls again – implying that if you are younger than 25 years old you are not as sexually active.
To make the dataset more simple we have taken averages on different decades from the 1900s to 2000s and found that the decade with the most different sexual partners on average is the 1990s with an average of 2.2 sexual partners.
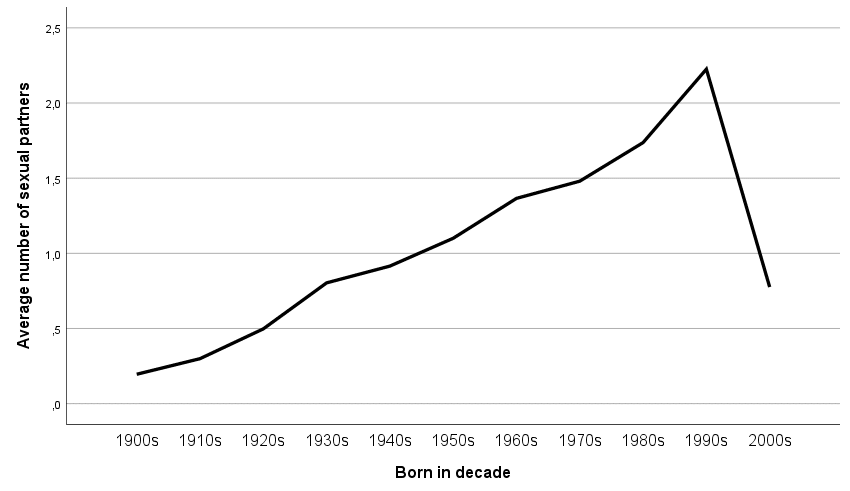
Please be aware that in data collection and analysis it is not possible to account for a change in how willingly/openly people report. This means that there is a reason to believe that the effect is also driven by younger generations being more open about how many they have been with sexually. This means that the young generation is both more promiscuous and also more open to admitting to it.
With a very limited number of respondents born in 1900 (even with surveys held throughout the 1970s and 1980s) we have simply been unable to gather enough data to give reliable numbers. The data became statistically significant around 1908.
Generations – Is the Millennial Generation more promiscuous than Generation X or Boomers?
We made a graphical overlay with the generations to ease understanding.
Total
Last 12 months
By Gender and Generation (all time)
By far the biggest revelation is the fact that systematically across generations women report to have had fewer different sexual partners. Women on average report to have had 68% fewer sexual partners than men.
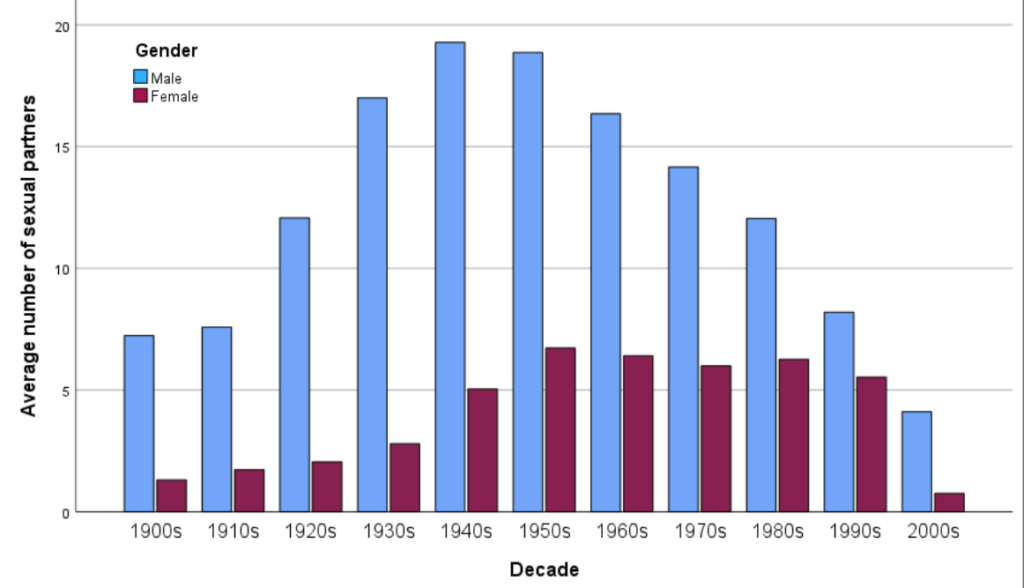
Although sexual preferences between genders might induce a slight difference in the actual average number of sexual partners that each gender has this is most likely caused by bias. Whether that bias is predominant for males reporting higher than actual or women reporting lower than their exact number is impossible to decipher from the dataset.
| Total sexual partners per Gender, and Generation | Men | Women |
|---|---|---|
| 1900s | 7.24 | 1.31 |
| 1910s | 7.58 | 1.73 |
| 1920s | 12.07 | 2.05 |
| 1930s | 17.00 | 2.79 |
| 1940s | 19.28 | 5.04 |
| 1950s | 18.86 | 6.73 |
| 1960s | 16.34 | 6.41 |
| 1970s | 14.16 | 6.00 |
| 1980s | 12.04 | 6.26 |
| 1990s | 8.20 | 5.53 |
| 2000s | 4.11 | 0.76 |
| Total | 12.44 | 4.05 |
By Gender and Generation (past 12 months)
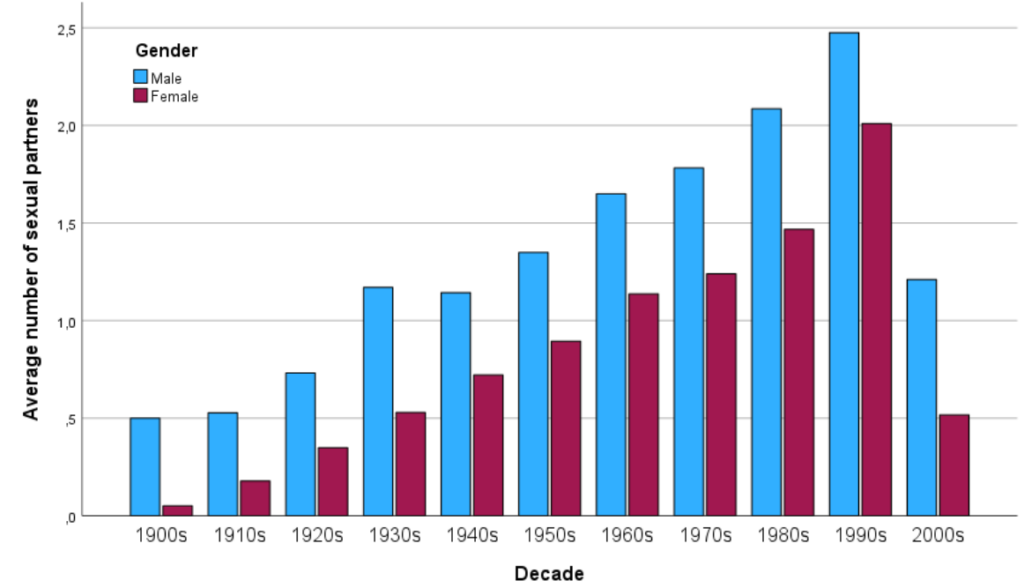
| Generation | Men | Women |
|---|---|---|
| 1900s | 0.500 | 0.051 |
| 1910s | 0.528 | 0.178 |
| 1920s | 0.731 | 0.348 |
| 1930s | 1.170 | 0.529 |
| 1940s | 1.143 | 0.721 |
| 1950s | 1.349 | 0.894 |
| 1960s | 1.650 | 1.137 |
| 1970s | 1.782 | 1.240 |
| 1980s | 2.085 | 1.468 |
| 1990s | 2.475 | 2.009 |
| 2000s | 1.211 | 0.517 |
| Total | 1.329 | 0.827 |
By Age and Gender (when asked at different times in the dataset)
An additional tabulation is to clarify what possible options you have for discovering insights into the dataset.
What we have done is has 3 parts:
- Aggregated survey results based on 4 periods: 1) 1991-2000, 2) 2001-2010, 3) 2011-2020, and 4) only in 2021
- Used age instead of birthyear to tabulate, as the separation of survey years mediates any biases induced by asking respondents in different years.
- To give additional clarity and insights we grouped age into 6 different groups and added gender as another variable.
| Survey year: | 1991 -2000 | 1991 -2000 | 2001 -2010 | 2001 -2010 | 2011 -2020 | 2011 -2020 | 2021 | 2021 |
|---|---|---|---|---|---|---|---|---|
| Gender → Born in ↓ | Men | Women | Men | Women | Men | Women | Men | Women |
| 1900s | 4.67 | 1.31 | . | . | . | . | . | . |
| 1910s | 7.60 | 1.76 | 9.93 | 1.54 | . | . | . | . |
| 1920s | 12.77 | 1.79 | 10.70 | 2.48 | 11.89 | 1.47 | . | . |
| 1930s | 18.98 | 3.20 | 16.32 | 2.63 | 8.79 | 2.05 | 23.89 | 2.70 |
| 1940s | 20.14 | 5.57 | 19.54 | 4.81 | 20.87 | 4.29 | 13.00 | 5.62 |
| 1950s | 17.19 | 6.87 | 22.37 | 7.17 | 19.22 | 6.70 | 20.83 | 6.44 |
| 1960s | 13.72 | 5.61 | 19.00 | 6.70 | 18.56 | 7.02 | 21.84 | 11.27 |
| 1970s | 9.49 | 4.09 | 15.69 | 6.41 | 16.65 | 6.87 | 20.16 | 9.89 |
| 1980s | 4.00 | 1.39 | 9.26 | 4.69 | 14.63 | 6.99 | 13.99 | 10.28 |
| 1990s | . | . | 2.58 | 2.17 | 6.93 | 5.03 | 13.30 | 7.35 |
| 2000s | . | . | . | . | 1.60 | 0.80 | 5.08 | 0.74 |
| Total: | 12.06 | 3.51 | 13.93 | 4.29 | 13.23 | 4.58 | 16.51 | 6.79 |
As the data for the past 12 months was unavailable in the 2021 dataset we only included 3 of the 4 survey periods.
| 1991-2000 | 1991-2000 | 2001-2010 | 2001-2010 | 2011-2020 | 2011-2020 | |
|---|---|---|---|---|---|---|
| Gender: | Male | Female | Male | Female | Male | Female |
| <20 | 1.97 | 1.26 | 3.75 | 1.66 | 1.76 | 1.26 |
| 21-30 | 2.00 | 1.37 | 2.14 | 1.53 | 1.98 | 1.44 |
| 31-40 | 1.73 | 1.09 | 1.59 | 1.13 | 1.54 | 1.18 |
| 41-50 | 1.34 | 0.96 | 1.48 | 1.08 | 1.23 | 1.07 |
| 51-60 | 1.05 | 0.75 | 1.18 | 0.75 | 1.09 | 0.75 |
| +60 | 0.73 | 0.33 | 0.98 | 0.40 | 0.81 | 0.44 |
| Total | 1.47 | 0.96 | 1.85 | 1.09 | 1.40 | 1.02 |
By age groups and gender – as percentage and population estimate
| Age group | No. Sexual partners | Women, Population Estimate | Women, % | | | Men, Population Estimate | Men, % |
|---|---|---|---|---|---|---|
| 15–19 | 0–1 partner | 7,541,000 | 72 | | | 7,627,000 | 70.5 |
| 15–19 | 2–4 partners | 18,050,000 | 17.2 | | | 1,877,000 | 17.4 |
| 15–19 | 5–9 partners | 828,000 | 7.9 | | | 722,000 | 6.7 |
| 15–19 | 10–39 partners | 54,000 | 2.9 | | | 556,000 | 5.1 |
| 15–19 | 40+ partners | — | — | | | 35,000 | 0.3 |
| – | – | – | – | – | – | – |
| 20–24 | 0–1 partner | 3,599,000 | 34.7 | | | 3,346,000 | 32.2 |
| 20–24 | 2–4 partners | 2,987,000 | 28.8 | | | 2,607,000 | 25.1 |
| 20–24 | 5–9 partners | 2,425,000 | 23.4 | | | 2,119,000 | 20.4 |
| 20–24 | 10–39 partners | 1,260,000 | 12.2 | | | 2,004,000 | 19.3 |
| 20–24 | 40+ partners | 94,000 | 0.9 | | | 318,000 | 3.1 |
| – | – | – | – | – | – | – |
| 25–29 | 0–1 partner | 2,625,000 | 24.9 | | | 1,849,000 | 17.2 |
| 25–29 | 2–4 partners | 3,219,000 | 30.6 | | | 2,757,000 | 25.6 |
| 25–29 | 5–9 partners | 2,528,000 | 24 | | | 2,659,000 | 24.7 |
| 25–29 | 10–39 partners | 1,955,000 | 18.6 | | | 2,986,000 | 27.8 |
| 25–29 | 40+ partners | 208,000 | 2 | | | 509,000 | 4.7 |
| – | – | – | – | – | – | – |
| 30–34 | 0–1 partner | 2,040,000 | 22.2 | | | 1,536,000 | 16.6 |
| 30–34 | 2–4 partners | 2,836,000 | 30.9 | | | 1,976,000 | 21.4 |
| 30–34 | 5–9 partners | 2,268,000 | 24.7 | | | 1,843,000 | 20 |
| 30–34 | 10–39 partners | 1,851,000 | 20.1 | | | 3,060,000 | 33.2 |
| 30–34 | 40+ partners | 193,000 | 2.1 | | | 812,000 | 8.8 |
| – | – | – | – | – | – | – |
| 35–39 | 0–1 partner | 2,454,000 | 23.3 | | | 1,691,000 | 16.3 |
| 35–39 | 2–4 partners | 3,188,000 | 30.3 | | | 2,235,000 | 21.5 |
| 35–39 | 5–9 partners | 2,902,000 | 27.5 | | | 2,081,000 | 20 |
| 35–39 | 10–39 partners | 1,839,000 | 17.5 | | | 3,556,000 | 34.2 |
| 35–39 | 40+ partners | 154,000 | 1.5 | | | 843,000 | 8.1 |
| – | – | – | – | – | – | – |
| 40–44 | 0–1 partner | 2,295,000 | 21.5 | | | 1,399,000 | 13.3 |
| 40–44 | 2–4 partners | 3,246,000 | 30.5 | | | 2,443,000 | 23.2 |
| 40–44 | 5–9 partners | 3,141,000 | 29.5 | | | 2,552,000 | 24.2 |
| 40–44 | 10–39 partners | 1,729,000 | 16.2 | | | 3,385,000 | 32.2 |
| 40–44 | 40+ partners | 240,000 | 2.3 | | | 747,000 | 7.1 |
| – | – | – | – | – | – | – |
| All | 0–1 partner | 3,425,667 | 33.1 | | | 2,908,000 | 27.7 |
| All | 2–4 partners | 5,587,667 | 28.1 | | | 2,315,833 | 22.4 |
| All | 5–9 partners | 2,348,667 | 22.8 | | | 1,996,000 | 19.3 |
| All | 10–39 partners | 1,448,000 | 14.6 | | | 2,591,166 | 25.3 |
| All | 40+ partners | 177,800 | 1.8 | | | 544,000 | 5.4 |
By Country
The global average number of sexual partners is placed at 9 for the age group 25-44 years old.
The same age group was used to rank the top 41 countries with enough available data to determine statistical significance.
Top 5 countries
- Turkey – with 14.5 average sexual partners at the age of 25-44
- Australia – with 13.2 average sexual partners at the age of 25-44
- New Zealand – with 13.2 average sexual partners at the age of 25-44
- Iceland – with 13.0 average sexual partners at the age of 25-44
- South Africa – with 12.5 average sexual partners at the age of 25-44
…
- Canada – with 10.7 average sexual partners at the age of 25-44
- United States – with 10.7 average sexual partners at the age of 25-44
- Greece – with 10.6 average sexual partners at the age of 25-44
Full tabulation, by country
As budget restraints did not allow for full longitudinal surveying of a large enough sample of each country we have aggregated datasets from multiple 3rd party sources. This should effectively adjust for individual discrepancies and measurement errors.
| # Rank | Country | Sexual Partners, Lifetime |
|---|---|---|
| 1 | Turkey | 14.5 |
| 2 | Australia | 13.3 |
| 3 | New Zealand | 13.2 |
| 4 | Iceland | 13 |
| 5 | South Africa | 12.5 |
| 6 | Finland | 12.4 |
| 7 | Norway | 12.1 |
| 8 | Italy | 11.8 |
| 9 | Sweden | 11.8 |
| 10 | Ireland | 11.1 |
| 11 | Switzerland | 11.1 |
| 12 | Canada | 10.7 |
| 13 | United States | 10.7 |
| 14 | Greece | 10.6 |
| 15 | Israel | 10.6 |
| 16 | Thailand | 10.6 |
| 17 | Japan | 10.2 |
| 18 | Chile | 10.1 |
| 19 | Serbia & Montenegro | 10.1 |
| 20 | United Kingdom | 9.8 |
| 21 | Austria | 9.7 |
| 22 | Denmark | 9.3 |
| 23 | Bulgaria | 9.1 |
| 24 | Czech Republic | 9 |
| 25 | France | 8.1 |
| 26 | Croatia | 7.5 |
| 27 | Belgium | 7.5 |
| 28 | Singapore | 7.2 |
| 29 | Netherlands | 7 |
| 30 | Portugal | 7 |
| 31 | Taiwan | 6.6 |
| 32 | Spain | 6.1 |
| 33 | Poland | 6 |
| 34 | Germany | 5.8 |
| 35 | Malaysia | 5.8 |
| 36 | Slovakia | 5.4 |
| 37 | Indonesia | 5.1 |
| 38 | Hong Kong | 3.7 |
| 39 | Vietnam | 3.2 |
| 40 | China | 3.1 |
| 41 | India | 3 |
| – | Global | 9 |