

![+15 Candle Industry Market [Statistics]](https://wp.bedbible.com/wp-content/uploads/2024/05/Candle-Industry-Statistics.png)
The candle industry is a dynamic and growing market, reaching $11 billion globally, with the U.S. contributing a significant portion. This report explores the industry’s market size, growth trends, popular candle types, and consumer preferences. With insights into the impact of events like COVID-19 and the rise of online sales, this comprehensive analysis offers a detailed look at the factors driving the candle market.
Here’s what we’ve covered:
- Market size
- Candle wax
- By type of candle
- Where are candles sold
- Most popular fragrances in scented candles
- Biggest candle companies
- Covid-19
Top Findings
- The candle industry has a market size of $11 billion globally
- The US candle industry is worth $4.7 billion (a staggering 42.7% of the global market size).
- The market size of the candle industry grows on average by +4% each year (CAGR).
- The market for candles is expected to reach $14 billion worldwide by 2030 ($6 billion in the US).
- Scented candles make up 34% of all candles sold annually ($3.6 billion worth of scented candles).
- 33% of candles are sold online.
- COVID-19 sparked a +17% increase in candles sold compared to previous years.
- 31% of all sold candles are container candles, with $3,286 Million sold annually.
Market Size
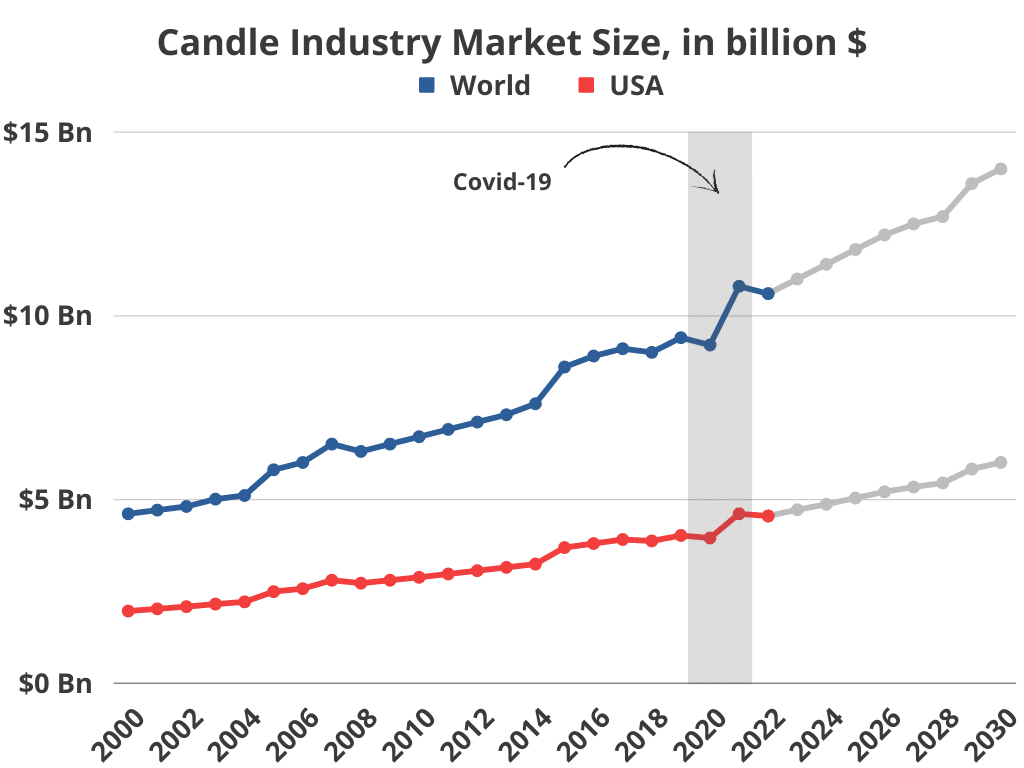
- The candle market is worth $11 Billion worldwide.
- The candle market on average grows +4% annually.
- The candle market is expected to reach $14 Billion by 2030.
- The US market share of the total candle market is $4.71 Billion.
- A staggering 42.7% of all candles worldwide are bought in the US.
- The US candle market is expected to reach $6 Billion by 2030.
- The total candle market has grown by +120% in the past 20 years.
| Year | Total Candle Market Size, World | CAGR, YoY Growth | Market share, US |
|---|---|---|---|
| 2000 | $4.56 Billion | – | $1.95 Billion |
| 2001 | $4.70 Billion | +3% | $2.01 Billion |
| 2002 | $4.84 Billion | +3% | $2.07 Billion |
| 2003 | $4.98 Billion | +3% | $2.14 Billion |
| 2004 | $5.13 Billion | +3% | $2.20 Billion |
| 2005 | $5.80 Billion | +13% | $2.48 Billion |
| 2006 | $5.97 Billion | +3% | $2.56 Billion |
| 2007 | $6.51 Billion | +9% | $2.79 Billion |
| 2008 | $6.32 Billion | -3% | $2.71 Billion |
| 2009 | $6.51 Billion | +3% | $2.79 Billion |
| 2010 | $6.71 Billion | +3% | $2.87 Billion |
| 2011 | $6.91 Billion | +3% | $2.96 Billion |
| 2012 | $7.12 Billion | +3% | $3.05 Billion |
| 2013 | $7.33 Billion | +3% | $3.14 Billion |
| 2014 | $7.55 Billion | +3% | $3.23 Billion |
| 2015 | $8.59 Billion | +14% | $3.68 Billion |
| 2016 | $8.85 Billion | +3% | $3.79 Billion |
| 2017 | $9.11 Billion | +3% | $3.9 Billion |
| 2018 | $9.09 Billion | -1% | $3.86 Billion |
| 2019 | $9.35 Billion | 4% | $4.01 Billion |
| 2020 | $9.20 Billion | -2% | $3.94 Billion |
| 2021 | $10.75 Billion | +17% | $4.60 Billion |
| 2022 | $10.6 Billion | -1% | $4.54 Billion |
| 2023 | $11.02 Billion | +4% | $4.71 Billion |
| 2024 | $11.35 Billion | +3% | $4.86 Billion |
| 2025 | $11.75 Billion | +4% | $5.03 Billion |
| 2026 | $12.15 Billion | +3% | $5.20 Billion |
| 2027 | $12.45 Billion | +2% | $5.33 Billion |
| 2028 | $12.71 Billion | +2% | $5.44 Billion |
| 2029 | $13.59 Billion | +7% | $5.82 Billion |
| 2030 | $14.01 Billion | +3% | $6.00 Billion |
Candle Wax
- Over one billion pounds of wax are used every year in the US candle industry to produce the candles sold.
- An estimated 3.7-4.5 billion pounds of candle wax are used globally.
The most common wax type used is paraffin, which is used in more than 92% of candles sold globally. Other popular candle wax types include:
- Soy wax
- Beeswax
- Palm wax
By Type of Candle
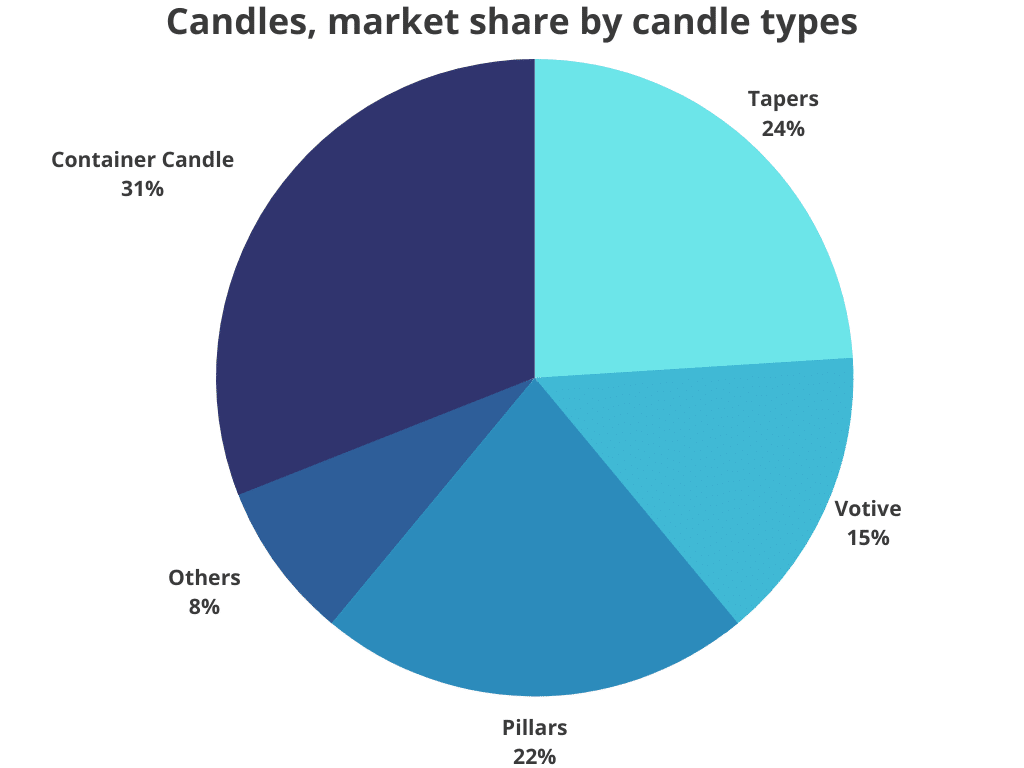
In the candle industry, a few very broad categories exist. Ranked from most popular, with the largest market share of the total candle market, the different candle types are:
- Container candles, with a market share of 31% of the total candle market, with sales exceeding $3.2 Billion annually.
- Taper candles, with a market share of 24% of the total candle market, with sales exceeding $2.5 Billion annually.
- Pillar candles, with a market share of 31% of the total candle market, with sales exceeding $3.2 Billion annually.
- Votive candles, with a market share of 15% of the total candle market, with sales exceeding $1.5 Billion annually.
- Other types of candles include Tea lights, jar candles, and tumbler vase candles. The remaining candle market is around 8% and is worth just shy of one billion USD.
Apart from that, some count scented candles as a “type of candle”. However, most different types can use both scented and unscented candle wax. Therefore, the following market share analysis between the different types of candles only focuses on structural differences and the relative market share. This is done to avoid overlap between categories.
| Rank | Candle type | Market share | Millions sold, World | Millions sold, US |
|---|---|---|---|---|
| 1 | Container candles | 31% | $3,286 | $1,408 |
| 2 | Taper candles | 24% | $2,544 | $1,090 |
| 3 | Pillar candles | 22% | $2,332 | $999 |
| 4 | Votive candles | 15% | $1,590 | $681 |
| 5 | Others (e.g. tea lights) | 8% | $848 | $363 |
Scented candles vs. unscented
As part of the market share analysis of different types of candles, we also looked at how the sales of scented candles looked compared to classic candles.
- The scented candles market size is $3.6 Billion (a 34% market share of the total $10.6 Billion candle market).
- 34% of all candles sold are scented, meaning they have some scent infused in the wax.
- The scented candle market is growing at +4.1% annually (CAGR) – slightly faster than the overall market.
Where Are Candles Sold
Generally, candles are sold in a wide variety of stores, such as:
- Specialty or gift shops.
- Department and home decor stores.
- Mass merchandisers (discount stores, drug store chains, grocery stores, etc.).
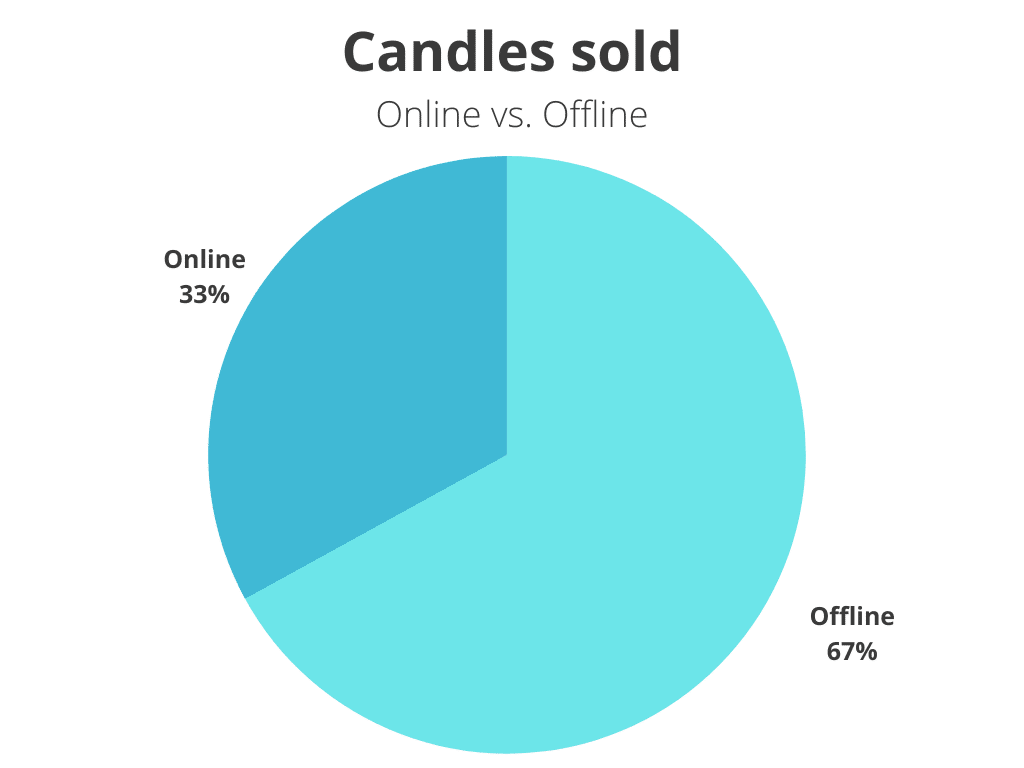
Online vs. offline
- 33% of candles are sold in online stores (e.g. Amazon, and Online specialty stores).
- 67% of candles are sold in physical stores (e.g. Department stores, Grocery stores, and Gift shops).
Most Popular Fragrances in Scented Candles
The most common types of candles produced by companies are scented candles, with popular fragrances including vanilla, lavender, and citrus.
We also looked into what types of scented people preferred in the market.
Albeit, this was slightly harder as most manufacturers, distributors, and stores (online or offline) typically rename classic scents.
Additionally, a lot of scented candles mix different scents.
Overall, this makes it difficult to standardize a method of categorizing SKUs (different scented candles).
Below are our best estimates on the most popular scents and the relative proportion of candles in which they are used:
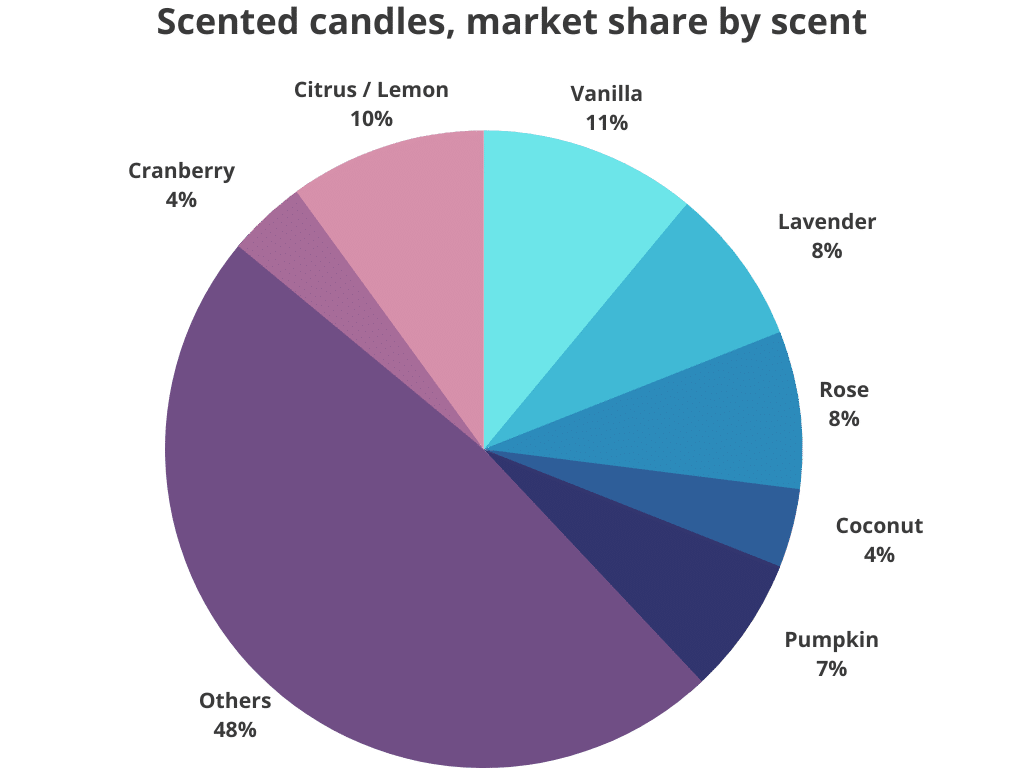
- 11% of all scented candles smell of vanilla.
- 10% of all scented candles smell of Citrus / Lemon.
- 8% of all scented candles smell of Lavender.
- 8% of all scented candles smell of Rose.
- 7% of all scented candles smell of Pumpkin.
- 4% of all scented candles smell of Coconut.
- 4% of all scented candles smell of Cranberry.
- 3% of all scented candles smell of Gardenia.
- 2% of all scented candles smell of Coffee.
- 2% of all scented candles smell of Amber.
- 2% of all scented candles smell of Sage.
- 2% of all scented candles smell of Cinnamon.
- 2% of all scented candles smell of Eucalyptus.
- 2% of all scented candles smell of Peppermint.
- 2% of all scented candles smell of Sandalwood.
- 2% of all scented candles smell of Chocolate.
- 1% of all scented candles smell of Fir.
- 1% of all scented candles smell of Cedar.
- <1% of all scented candles smell of Leather.
- <1% of all scented candles smell of Musk.
- <1% of all scented candles smell of Patchouli.
- <1% of all scented candles smell of Tobacco.
- <1% of all scented candles smell of Oud.
- <1% of all scented candles smell of Teakwood.
Apart from that around 24% of scented candles fell in “Others”. Typically because they A) were a mix with no dominating smell listed, making it uncategorizable in one category, B) were scented candles without specific listed natural scents, or C) were scented candles without any description of the scent type.
Biggest Candle Companies
The world’s single biggest candle producer is SC Johnson & Sons, who annually sell candles for $184 million.
The world’s second and third biggest producers are The Yankee Candle Company (with $132 million in annual sales), and Newell Brands (with $113 million).
Other big candle producers and sellers include:
- Bath & Body Works
- Better Homes and Garden
- Bridgewater Candles
- Colonial Candle
- Conscious Candle Company
- Contract Candles & Diffusers Ltd.
- Circle E Candles
- Diptyque
- Ellis Brooklyn
- Jo Malone London
- Le Labo
- Malin + Goetz
- NEST
- Slatkin & Co
- Thymes
- TRUDON
- Village Candles
- White Barn Candles
- Yankee Candles
Covid-19
The COVID-19 pandemic has increased demand for candles, as people spend more time at home and look for ways to create a cozy and relaxing atmosphere.
This can be seen in the +17% increase in the candle industry in the year following the outbreak of Covid-19. A significant increase unmatched by any other year in the industry’s history – and compared to the average annual growth of +4%.