

![How Many People Get Catfished [Statistics]](https://wp.bedbible.com/wp-content/uploads/2023/01/catfishing-statistics-2.png)
Catfishing, the deceptive practice where someone creates a fake identity to engage in misleading online relationships, is a growing concern in today’s digital age.
This report aims to provide a comprehensive overview of the prevalence and impact of catfishing across the United States. By analyzing data state-by-state, examining trends over the past four years, and exploring the financial ramifications, we offer a detailed look at how catfishing affects various demographics. Additionally, we delve into the influence of age and gender, highlighting significant differences and outcomes.
Previous studies have left many questions unanswered, but through this report, we strive to shed light on this increasingly pertinent issue., the number of reported cases, the total and average amount of financial losses associated with those catfish cases, as well as extensive survey responses from victims and perpetrators.
Table of contents:
- Catfishing state-by-state
- Catfishing cases over time
- Financial losses over time
- Age and catfishing
- Gender differences
- Attempted catfishing and outcomes, by gender
- Previous studies have no clear answer
Key Takeaways
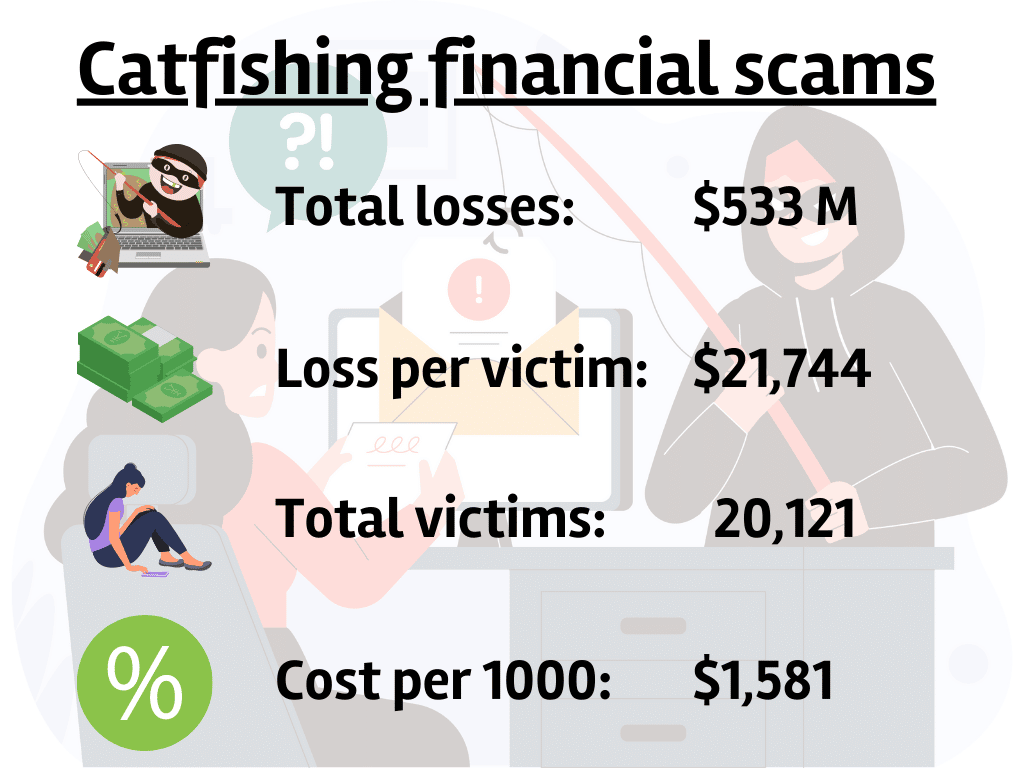
- More than $533 million were reported lost to catfishing.
- 35,195 cases of catfishing have been reported in 2022, and 104,140 catfishing cases were reported in the 4 years 2019-2022.
- Men are twice as likely to become catfishing victims compared to women, who in return are 50% more likely to be a catfishing perpetrator.
- Catfishing cases on average report to have lost $21,744.
- Around 7% of people who experience a catfishing attempt fall victim to the scam.
- 1 in 3 reports that they have experienced someone trying to catfish them.
- 62% of male catfish victims sent money to the catfish (while only 22% of female catfish victims lost money).
- 60-69-year-olds are most likely to fall victim to catfishing and lose more money on average than any other age group.
- Victims of catfishing in Oklahoma lost the most amount of money on average, with an average of $70,288 lost per case.
- Total losses due to catfishing amounted to over $150M in California in 2022.
Catfishing state-by-state
During 2022 more than $533 million were lost in Catfishing / Romance scams online. And those are only the publicly available numbers (reported by victims). It is estimated that many more suffer from economic losses due to catfishing.
Top 10 states with highest financial losses per victim
The data shows that the top 10 states with the most losses per victim are:
- Oklahoma – with losses of $70,288 on average per victim out of 212 reported cases
- Montana – with losses of $68,102 on average per victim out of 68 reported cases
- Massachusetts – with losses of $62,018 on average per victim out of 361 reported cases
- California – with losses of $48,891 on average per victim out of 3,110 reported cases
- Louisiana – with losses of $44,859 on average per victim out of 228 reported cases
- Washington – with losses of $33,700 on average per victim out of 579 reported cases
- Florida – with losses of $31,916 on average per victim out of 1,603 reported cases
- Rhode Island – with losses of $29,300 on average per victim out of 80 reported cases
- Delaware – with losses of $28,007 on average per victim out of 58 reported cases
- Colorado – with losses of $25,382 on average per victim out of 439 reported cases
Top 10 states with the biggest total financial losses
Looking at the total losses of each state the top 10 states are:
- California – placed number 1 with a total aggregated loss of $152,051,010 based on 3110 victims
- Florida – placed number 2 with a total aggregated loss of $51,161,348 based on 1603 victims
- Texas – placed number 3 with a total aggregated loss of $40,347,972 based on 1602 victims
- New York – placed number 4 with a total aggregated loss of $23,333,965 based on 1103 victims
- Massachusetts – placed number 5 with a total aggregated loss of $22,388,498 based on 361 victims
- Washington – placed number 6 with a total aggregated loss of $19,512,300 based on 579 victims
- Pennsylvania – placed number 7 with a total aggregated loss of $17,128,928 based on 736 victims
- Oklahoma – placed number 8 with a total aggregated loss of $14,901,056 based on 212 victims
- Illinois – placed number 9 with a total aggregated loss of $14,672,976 based on 688 victims
- Colorado – placed number 10 with a total aggregated loss of $11,142,698 based on 439 victims
Most losses per citizen
Finally, looking at what states have the most losses per citizen we find that a staggering amount of losses can be attributed directly to catfishing scams:
- Montana – placed number 1 with an average loss of $4,162.1 per thousand citizens
- California – placed number 2 with an average loss of $3,780.2 per thousand citizens
- Oklahoma – placed number 3 with an average loss of $3,705.1 per thousand citizens
- Massachusetts – placed number 4 with an average loss of $3,120.5 per thousand citizens
- Washington – placed number 5 with an average loss of $2,439.2 per thousand citizens
- Florida – placed number 6 with an average loss of $2,288.2 per thousand citizens
- Louisiana – placed number 7 with an average loss of $2,178.4 per thousand citizens
- Rhode Island – placed number 8 with an average loss of $2,110.2 per thousand citizens
- Colorado – placed number 9 with an average loss of $1,858.0 per thousand citizens
- Utah – placed number 10 with an average loss of $1,722.6 per thousand citizens
All US states, by loss per victim, no. of victims, and total losses
| # | State | ↓ Loss per victim ($) | No. of victims | Total losses ($) |
|---|---|---|---|---|
| 1 | Oklahoma | 70,288 | 212 | 14,901,056 |
| 2 | Montana | 68,102 | 68 | 4,630,936 |
| 3 | Massachusetts | 62,018 | 361 | 22,388,498 |
| 4 | California | 48,891 | 3,110 | 152,051,010 |
| 5 | Louisiana | 44,859 | 228 | 10,227,852 |
| 6 | Washington | 33,700 | 579 | 19,512,300 |
| 7 | Florida | 31,916 | 1,603 | 51,161,348 |
| 8 | Rhode Island | 29,300 | 80 | 2,344,000 |
| 9 | Delaware | 28,007 | 58 | 1,624,406 |
| 10 | Colorado | 25,382 | 439 | 11,142,698 |
| 11 | Texas | 25,186 | 1,602 | 40,347,972 |
| 12 | Pennsylvania | 23,273 | 736 | 17,128,928 |
| 13 | Hawaii | 22,744 | 109 | 2,479,096 |
| 14 | Arkansas | 22,622 | 149 | 3,370,678 |
| 15 | South Carolina | 22,149 | 250 | 5,537,250 |
| 16 | New Jersey | 21,433 | 485 | 10,395,005 |
| 17 | Illinois | 21,327 | 688 | 14,672,976 |
| 18 | Alabama | 21,166 | 226 | 4,783,516 |
| 19 | New York | 21,155 | 1,103 | 23,333,965 |
| 20 | Maryland | 20,719 | 405 | 8,391,195 |
| 21 | Utah | 19,926 | 296 | 5,898,096 |
| 22 | Connecticut | 19,103 | 199 | 3,801,497 |
| 23 | Minnesota | 18,862 | 307 | 5,790,634 |
| 24 | New Hampshire | 17,195 | 71 | 1,220,845 |
| 25 | Virginia | 17,163 | 531 | 9,113,553 |
| 26 | Missouri | 16,965 | 339 | 5,751,135 |
| 27 | Tennessee | 16,889 | 334 | 5,640,926 |
| 28 | Oregon | 16,673 | 308 | 5,135,284 |
| 29 | West Virginia | 16,339 | 107 | 1,748,273 |
| 30 | Kansas | 15,984 | 136 | 2,173,824 |
| 31 | Idaho | 15,451 | 130 | 2,008,630 |
| 32 | Iowa | 15,427 | 145 | 2,236,915 |
| 33 | Georgia | 14,930 | 515 | 7,688,950 |
| 34 | Michigan | 14,745 | 572 | 8,434,140 |
| 35 | New Mexico | 14,463 | 189 | 2,733,507 |
| 36 | Nevada | 14,272 | 362 | 5,166,464 |
| 37 | North Carolina | 14,038 | 558 | 7,833,204 |
| 38 | Mississippi | 13,831 | 135 | 1,867,185 |
| 39 | Arizona | 13,378 | 559 | 7,478,302 |
| 40 | Nebraska | 13,093 | 130 | 1,702,090 |
| 41 | South Dakota | 13,006 | 32 | 416,192 |
| 42 | Wisconsin | 12,617 | 355 | 4,479,035 |
| 43 | Ohio | 12,562 | 528 | 6,632,736 |
| 44 | Vermont | 12,463 | 46 | 573,298 |
| 45 | Alaska | 11,947 | 92 | 1,099,124 |
| 46 | Indiana | 11,282 | 332 | 3,745,624 |
| 47 | Kentucky | 9,955 | 174 | 1,732,170 |
| 48 | North Dakota | 9,327 | 47 | 438,369 |
| 49 | Wyoming | 7,279 | 44 | 320,276 |
| 50 | Maine | 3,820 | 57 | 217,740 |
| # | United States | 21,744 (avg) | 402 (avg), 20,121 (total) | $533 million (total losses) |
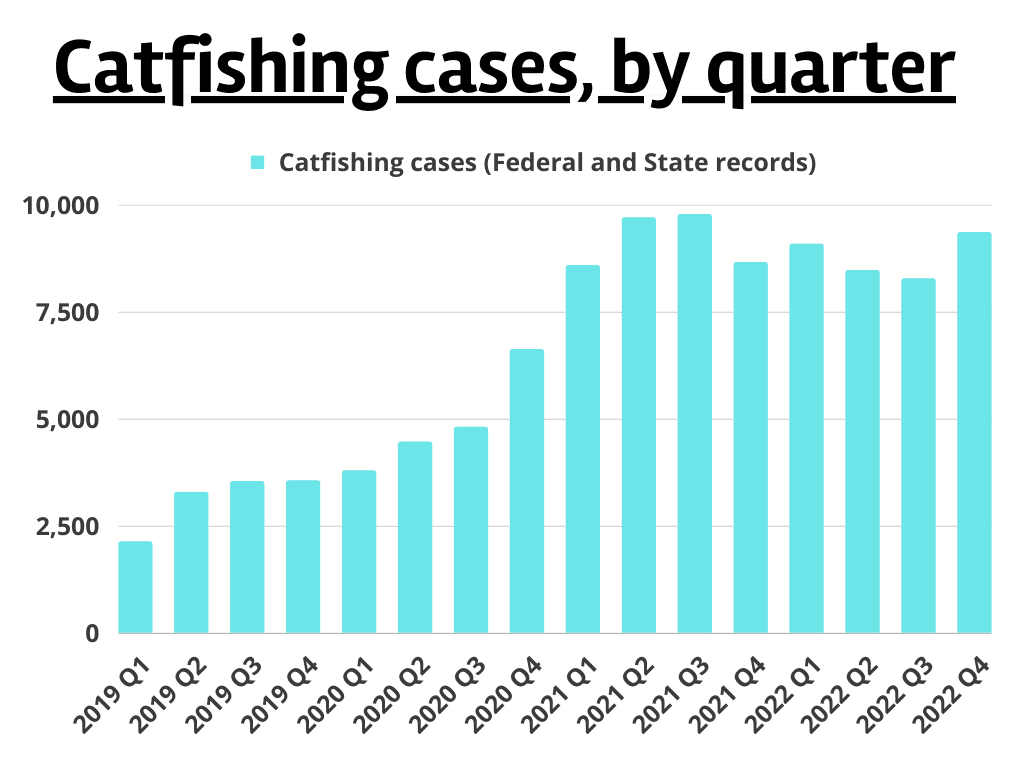
Catfishing cases over time
For the last 4 years, we have aggregated data on all the romance scam and financial catfishing cases.
Peak and Trough Values:
- The peak number of catfishing cases occurred in Q3 2021, with a total of 9,779 cases.
- The lowest number of catfishing cases was recorded in Q1 2019, with a total of 2,134 cases.
Here is a graphic illustration and a table with the raw data:
Overall Trend Over the 4 Years
- There’s a clear upward trend in catfishing cases over the last 4 years. The number of cases increased steadily from 2019 through 2021.
- The peak appears to be in Q3 2021, after which there’s a slight decline in the number of cases. However, by the end of 2022, the cases began to rise again.
| Period | Cases (Federal and State cases) |
|---|---|
| 2019 Q1 | 2,134 |
| 2019 Q2 | 3,292 |
| 2019 Q3 | 3,541 |
| 2019 Q4 | 3,558 |
| 2020 Q1 | 3,792 |
| 2020 Q2 | 4,463 |
| 2020 Q3 | 4,812 |
| 2020 Q4 | 6,627 |
| 2021 Q1 | 8,590 |
| 2021 Q2 | 9,700 |
| 2021 Q3 | 9,779 |
| 2021 Q4 | 8,657 |
| 2022 Q1 | 9,088 |
| 2022 Q2 | 8,473 |
| 2022 Q3 | 8,277 |
| 2022 Q4 | 9,357 |
| 4 Year Period | 104,114 investigated cases |
Year-over-Year Change
The year 2020 witnessed significant increases in catfishing cases compared to 2019, with a particularly strong surge in Q4 2020, where there was an 86.26% increase compared to Q4 2019.
2021 saw even more substantial increases, especially in the first three quarters. The cases in Q1 2021 increased by a whopping 126.53% compared to Q1 2020.
However, starting from Q4 2021, there was a noticeable slowdown in the year-over-year growth, with Q4 2021 having only a 30.63% increase compared to Q4 2020.
2022 shows mixed results. While there was a modest increase in Q1 2022 compared to Q1 2021, Q2 and Q3 2022 experienced year-over-year declines of 12.65% and 15.36%, respectively. Q4 2022, however, again saw an increase of 8.09% compared to Q4 2021.
Quarterly Variations
- On average, Q4 has the highest number of catfishing cases over the four years, with approximately 7,050 cases.
- Q3 follows closely with an average of approximately 6,602 cases.
- Q2 has an average of around 6,482 cases.
- Q1 tends to have the fewest cases on average, with about 5,901 cases.
Financial losses over time
Aggregating the financial losses reported in each case, for each quarter, we have made a table showing the total amount of financial losses to catfishes.
Over the last 4 years, almost $ 1.5 billion worth of losses have been reported and recorded.
This does not, however, account for all the unreported cases not included in this dataset.
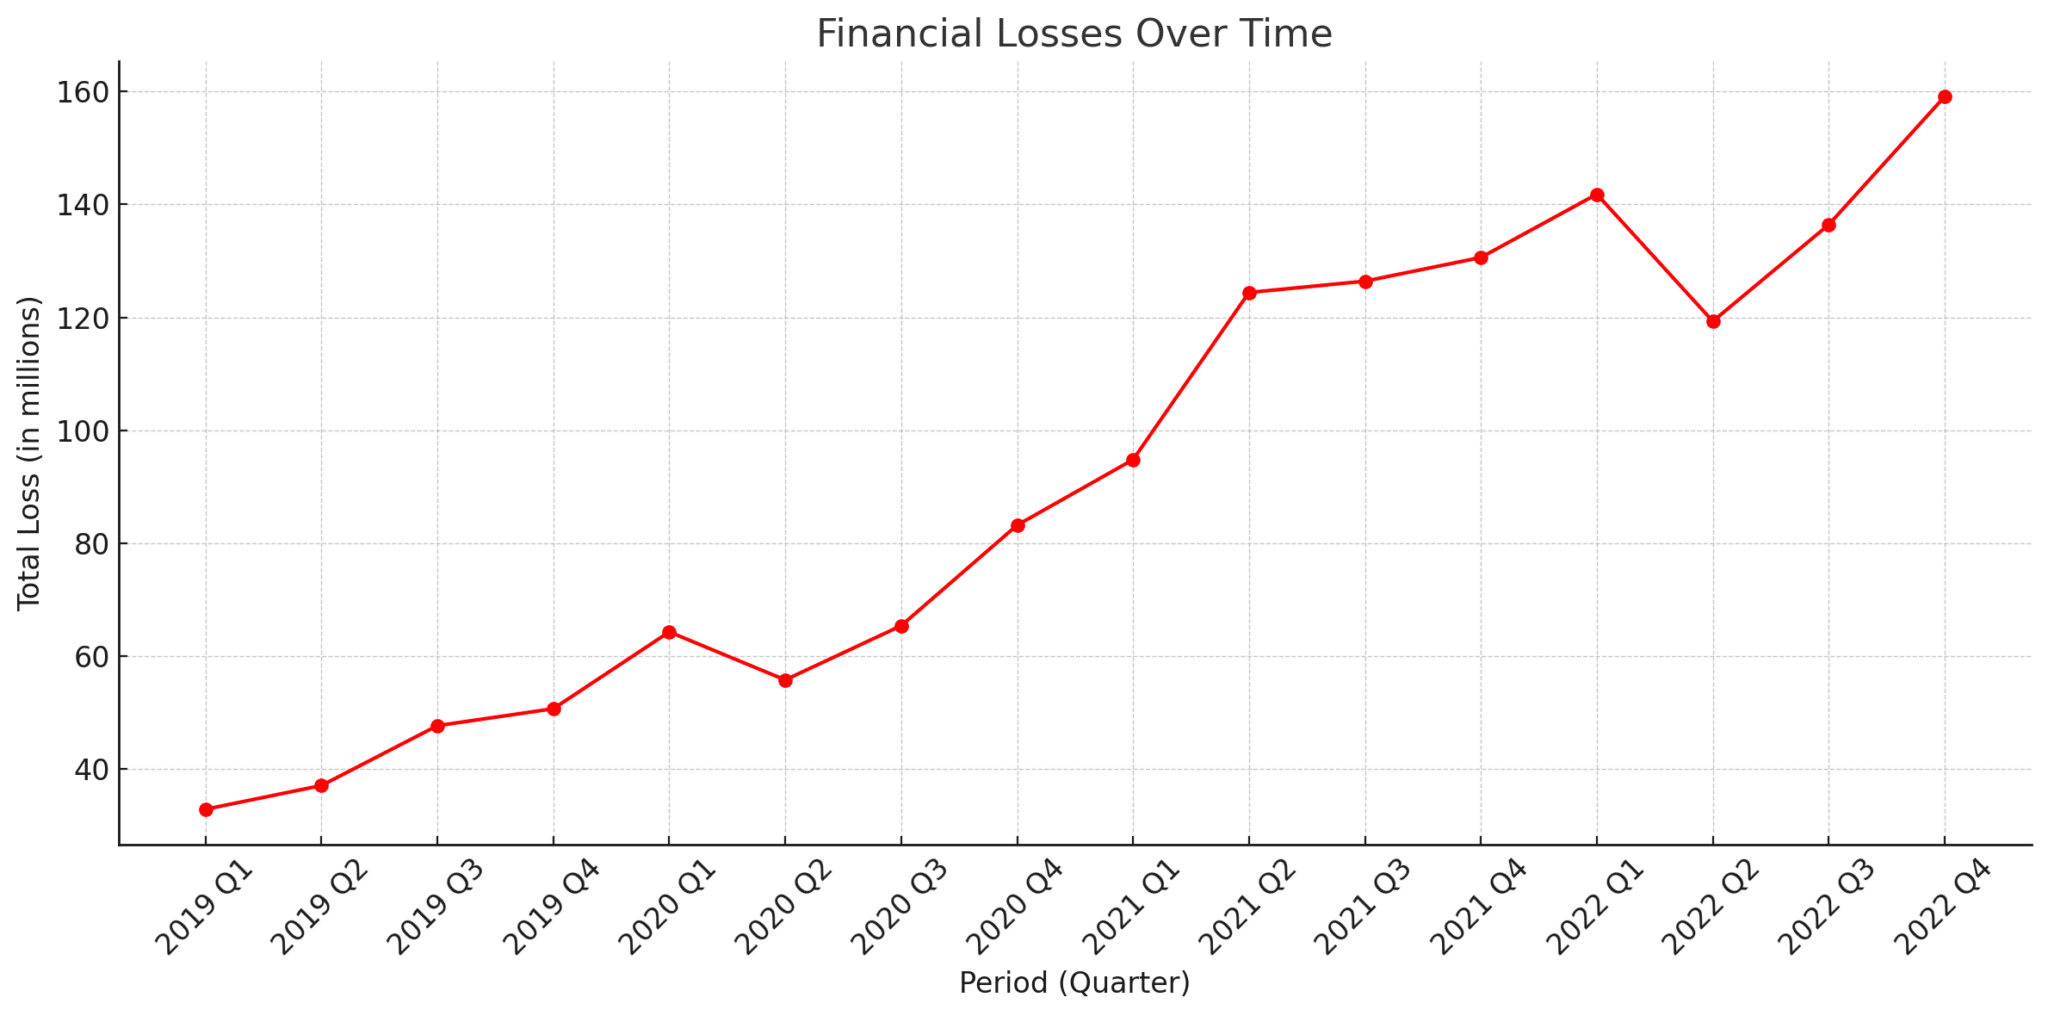
- Financial losses due to catfishing have consistently increased over the past four years.
- 2020 saw notable year-over-year rises in losses, especially in the first quarter.
- 2021 continued the trend with significant increases, peaking in the second quarter.
- 2022 showed mixed results, with some quarters experiencing a slowdown in the rate of increase, and even a decline in Q2. However, Q4 2022 recorded the highest loss in the dataset.
- Q4, on average, tends to have the highest financial losses, suggesting potential seasonality or other external factors influencing this trend.
- The maximum financial loss was in Q4 2022, while the minimum was in Q1 2019.
Year-over-Year Change in Financial Losses
The year 2020 experienced significant increases in financial losses compared to 2019, with the most substantial surge in Q1 2020, where there was a 95.44% increase compared to Q1 2019.
In 2021, the first three quarters again witnessed significant year-over-year increases, with Q2 2021 having a striking 122.94% increase compared to Q2 2020.
By 2022, the rate of increase seemed to slow down, especially in Q2, which saw a 4.10% decline in losses compared to Q2 2021. However, Q4 2022 had a 21.82% increase compared to Q4 2021.
Quarterly Variations in Financial Losses:
On average, Q4 has the highest financial losses due to catfishing over the four years, with approximately $105.9 million.
Q3 follows with an average loss of approximately $94 million.
Q2 and Q1 are closer in values with averages of approximately $84.15 million and $83.45 million, respectively.
Peak and Trough Values for Financial Losses
The peak financial loss due to catfishing was recorded in Q4 2022, with a total loss of $159.1 million.
The lowest financial loss was observed in Q1 2019, amounting to $32.9 million.
| Period | Total Loss |
|---|---|
| 2019 Q1 | $32.9 millions |
| 2019 Q2 | $37.1 millions |
| 2019 Q3 | $47.7 millions |
| 2019 Q4 | $50.7 millions |
| 2020 Q1 | $64.3 millions |
| 2020 Q2 | $55.8 millions |
| 2020 Q3 | $65.4 millions |
| 2020 Q4 | $83.2 millions |
| 2021 Q1 | $94.8 millions |
| 2021 Q2 | $124.4 millions |
| 2021 Q3 | $126.4 millions |
| 2021 Q4 | $130.6 millions |
| 2022 Q1 | $141.8 millions |
| 2022 Q2 | $119.3 millions |
| 2022 Q3 | $136.4 millions |
| 2022 Q4 | $159.1 millions |
| All 4 years | $1,469.9 millions |
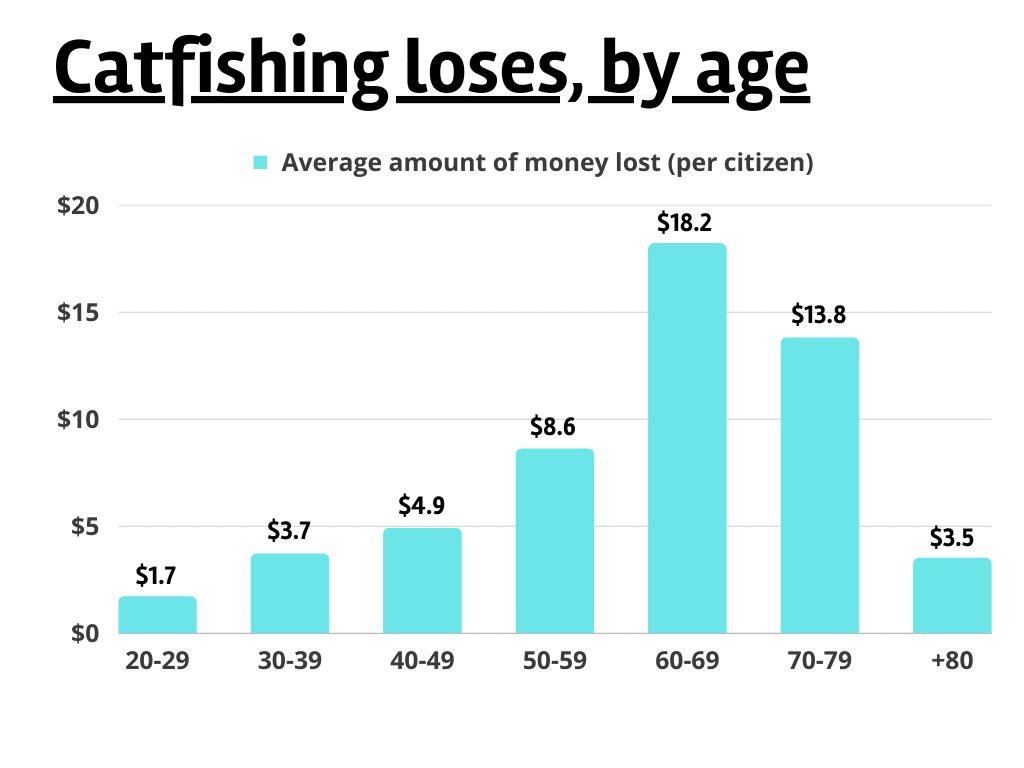
Age and catfishing
Certain demographic groups, especially when it comes to age revealed some incredible differences.
Age groups most exposed to catfishing where the 60-69 year olds, whom on average have lost $18.2 to different romance scams.
- The number of cases is fairly consistent across age groups from 20-59, with a decrease for older age groups.
- The age group 60-69 has the highest total financial losses, despite not having the most cases.
- Older age groups (70-79 and +80) tend to lose more money on average per catfishing case.
- The age group 60-69 has the highest percentage of its population being catfished.
- In terms of financial impact per citizen, the age group 60-69 experiences the highest loss, followed by the 70-79 age group.
Distribution of Cases and Financial Losses Across Age Groups
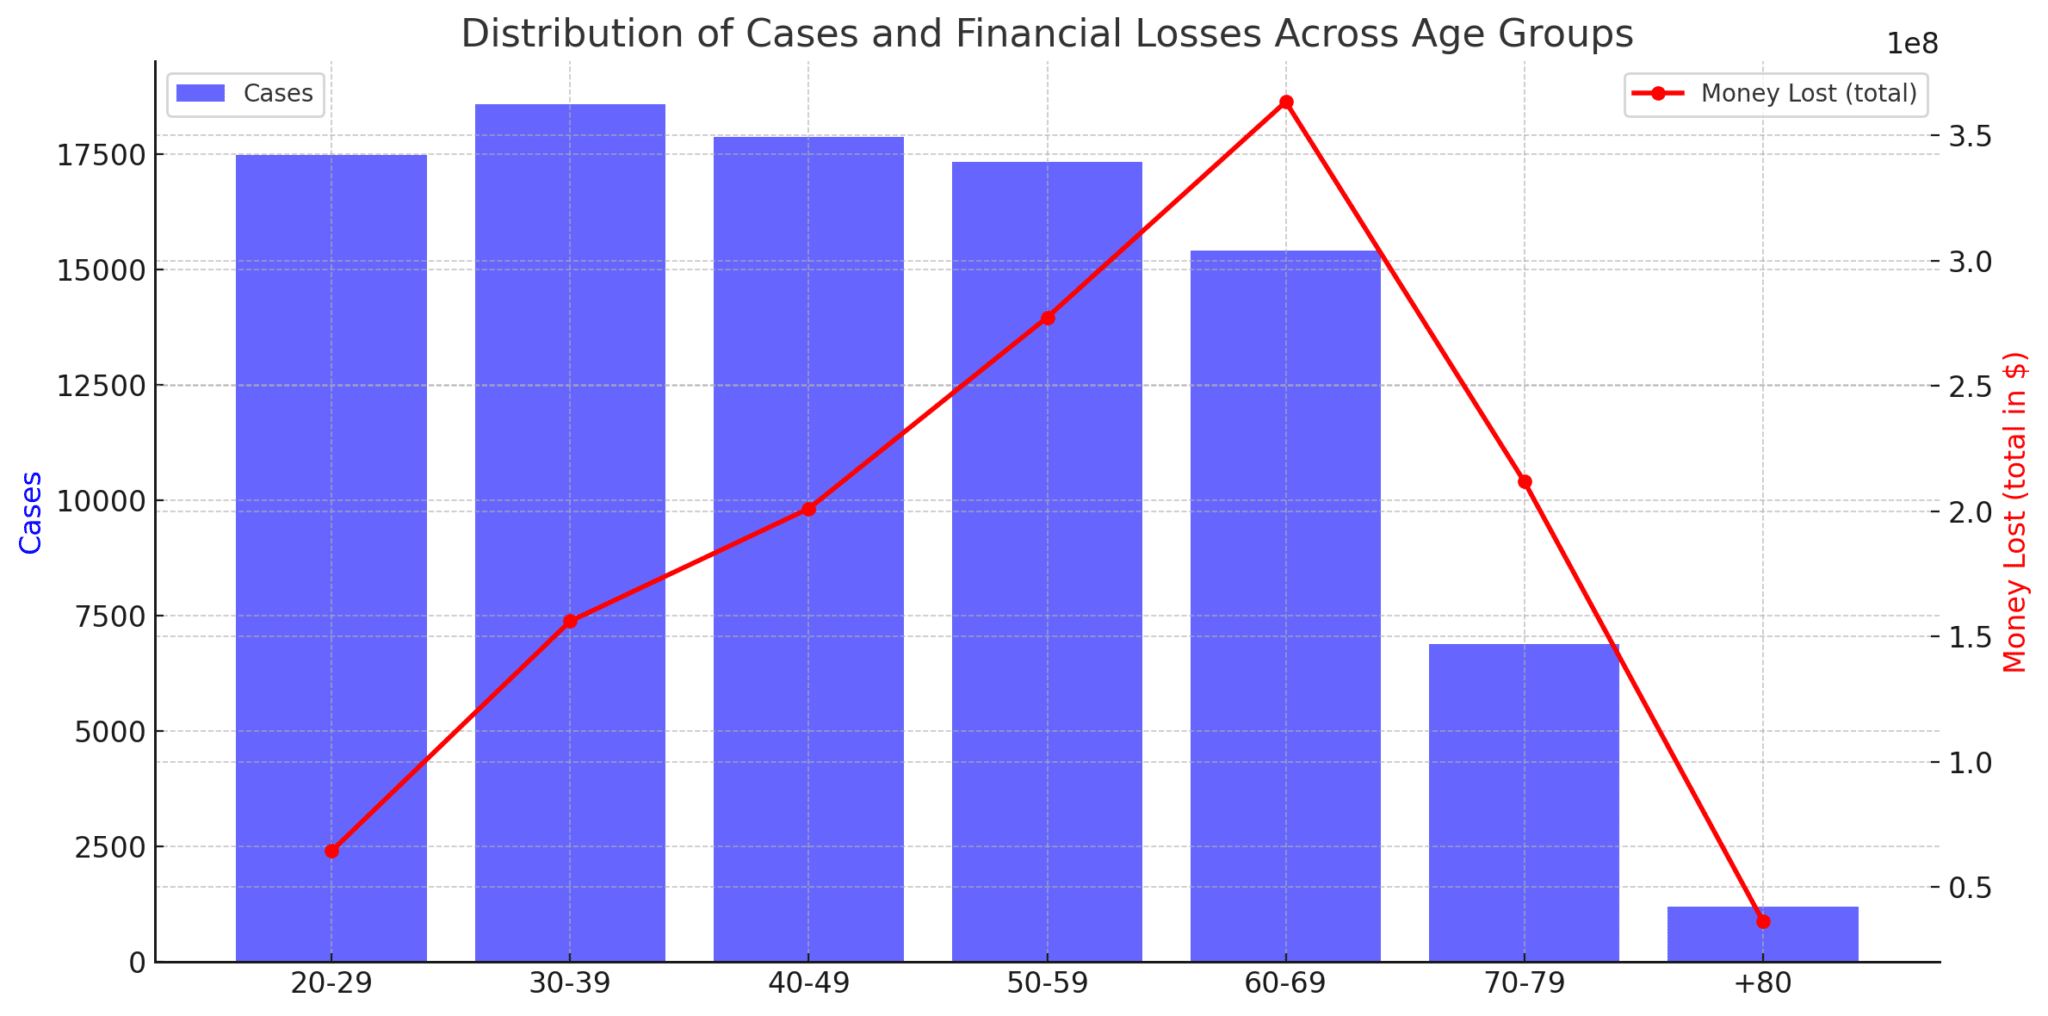
The number of cases is relatively consistent across age groups from 20-59, with a noticeable decline for older age groups (70-79 and +80).
In terms of financial losses, the age group 60-69 stands out with the highest total loss, even though they don’t have the highest number of cases. This suggests that individuals in this age group tend to lose more money per case on average.
The 50-59 and 70-79 age groups also exhibit significant financial losses.
Average Money Lost Per Case Across Age Groups
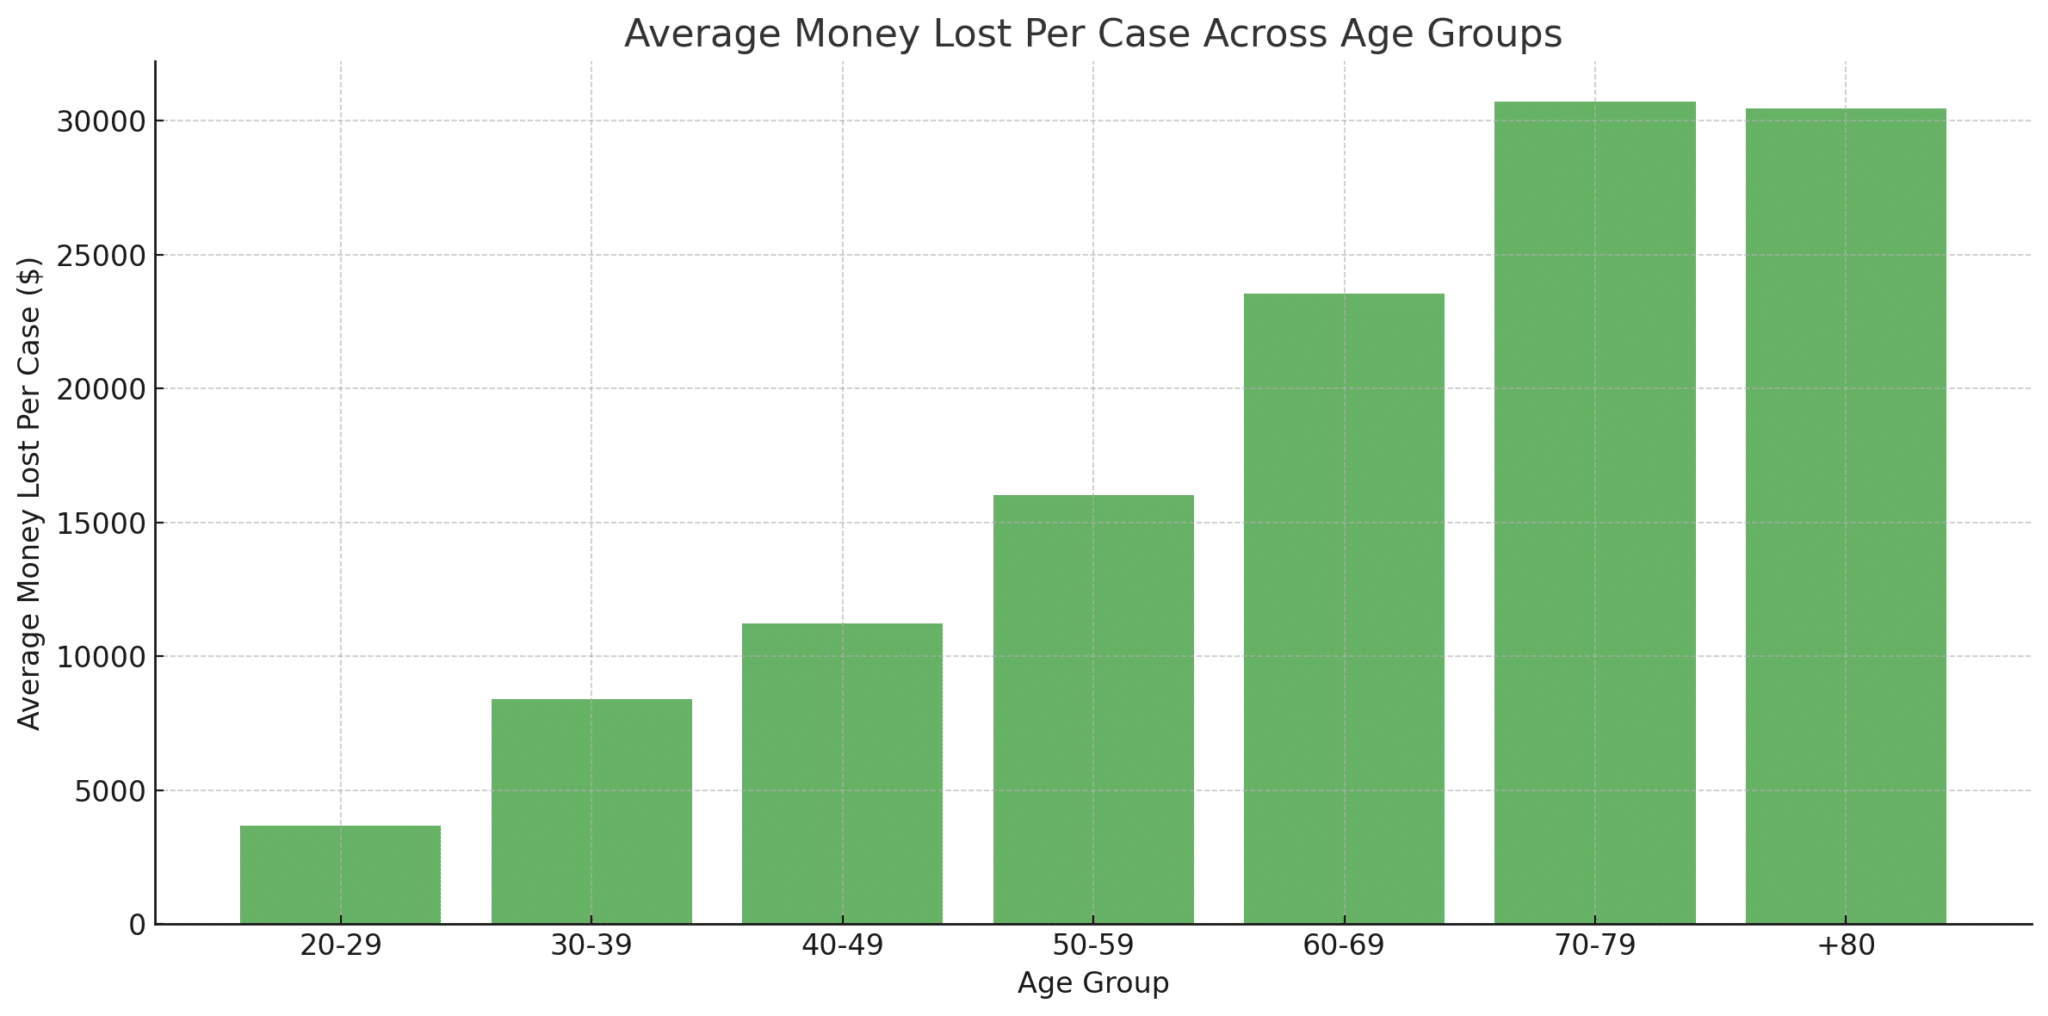
The age groups 70-79 and +80 have the highest average financial loss per catfishing case, with amounts surpassing $30,000.
The age group 60-69 also has a high average loss, close to $24,000 per case.
Younger age groups, such as 20-29, 30-39, and 40-49, tend to have lower average losses per case, with the 20-29 group having the lowest average loss.
Percentage of the Population Catfished in Each Age Group
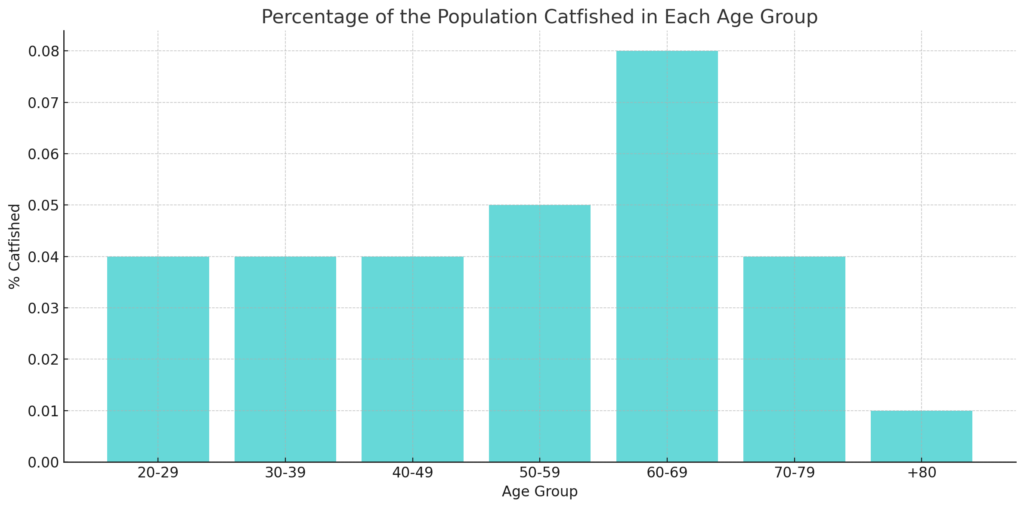
The age group 60-69 has the highest percentage of its population being catfished, at approximately 0.08%.
Other age groups mostly hover around the 0.04% mark, with the +80 age group having the lowest percentage at approximately 0.01%.
Money Lost Per Citizen in Each Age Group
The age group 60-69 stands out with the highest financial impact per citizen, at approximately $18.2.
The 50-59 and 70-79 age groups follow with values of $8.6 and $13.8, respectively.
Younger age groups, such as 20-29 and 30-39, have relatively lower financial impacts per citizen, with the 20-29 group having the lowest impact at $1.7 per citizen.
Overview of data
| Age Group | Cases | Money Lost (total) | Money lost (per case) | Population | Percent of total | % catfished | Money lost (per citizen) |
|---|---|---|---|---|---|---|---|
| 20-29 | 17,479 | $64,297,224 | $3,679 | 38,909,863 | 13.8% | 0.04% | $1.7 |
| 30-39 | 18,598 | $156,066,108 | $8,392 | 42,520,126 | 15.1% | 0.04% | $3.7 |
| 40-49 | 17,876 | $201,007,364 | $11,245 | 41,413,240 | 14.7% | 0.04% | $4.9 |
| 50-59 | 17,331 | $277,391,594 | $16,006 | 32,308,213 | 11.5% | 0.05% | $8.6 |
| 60-69 | 15,426 | $363,463,711 | $23,562 | 20,000,940 | 7.1% | 0.08% | $18.2 |
| 70-79 | 6,898 | $211,802,085 | $30,705 | 15,376,083 | 5.5% | 0.04% | $13.8 |
| +80 | 1,193 | $36,324,476 | $30,448 | 10,420,177 | 3.7% | 0.01% | $3.5 |
Gender differences
Who are most likely to get catfished, and be the catfish that perpetrates the crime of catfishing?
Our main findings:
- Men are more likely to be victims of catfishing, making up 71% of the victims.
- Women are more likely to be the perpetrators of catfishing, making up 64% of the culprits.
- Men have a higher likelihood (9%) of falling for a catfishing attempt compared to women (4%).
- Women are more prone to send nude pictures during a scam, with 35% of female victims doing so, compared to 11% of male victims.
- Men are substantially more inclined to send money during a catfishing scam, with 62% of male victims doing so, in contrast to 22% of female victims.
Distribution of Catfish Victims and Perpetrators by Gender
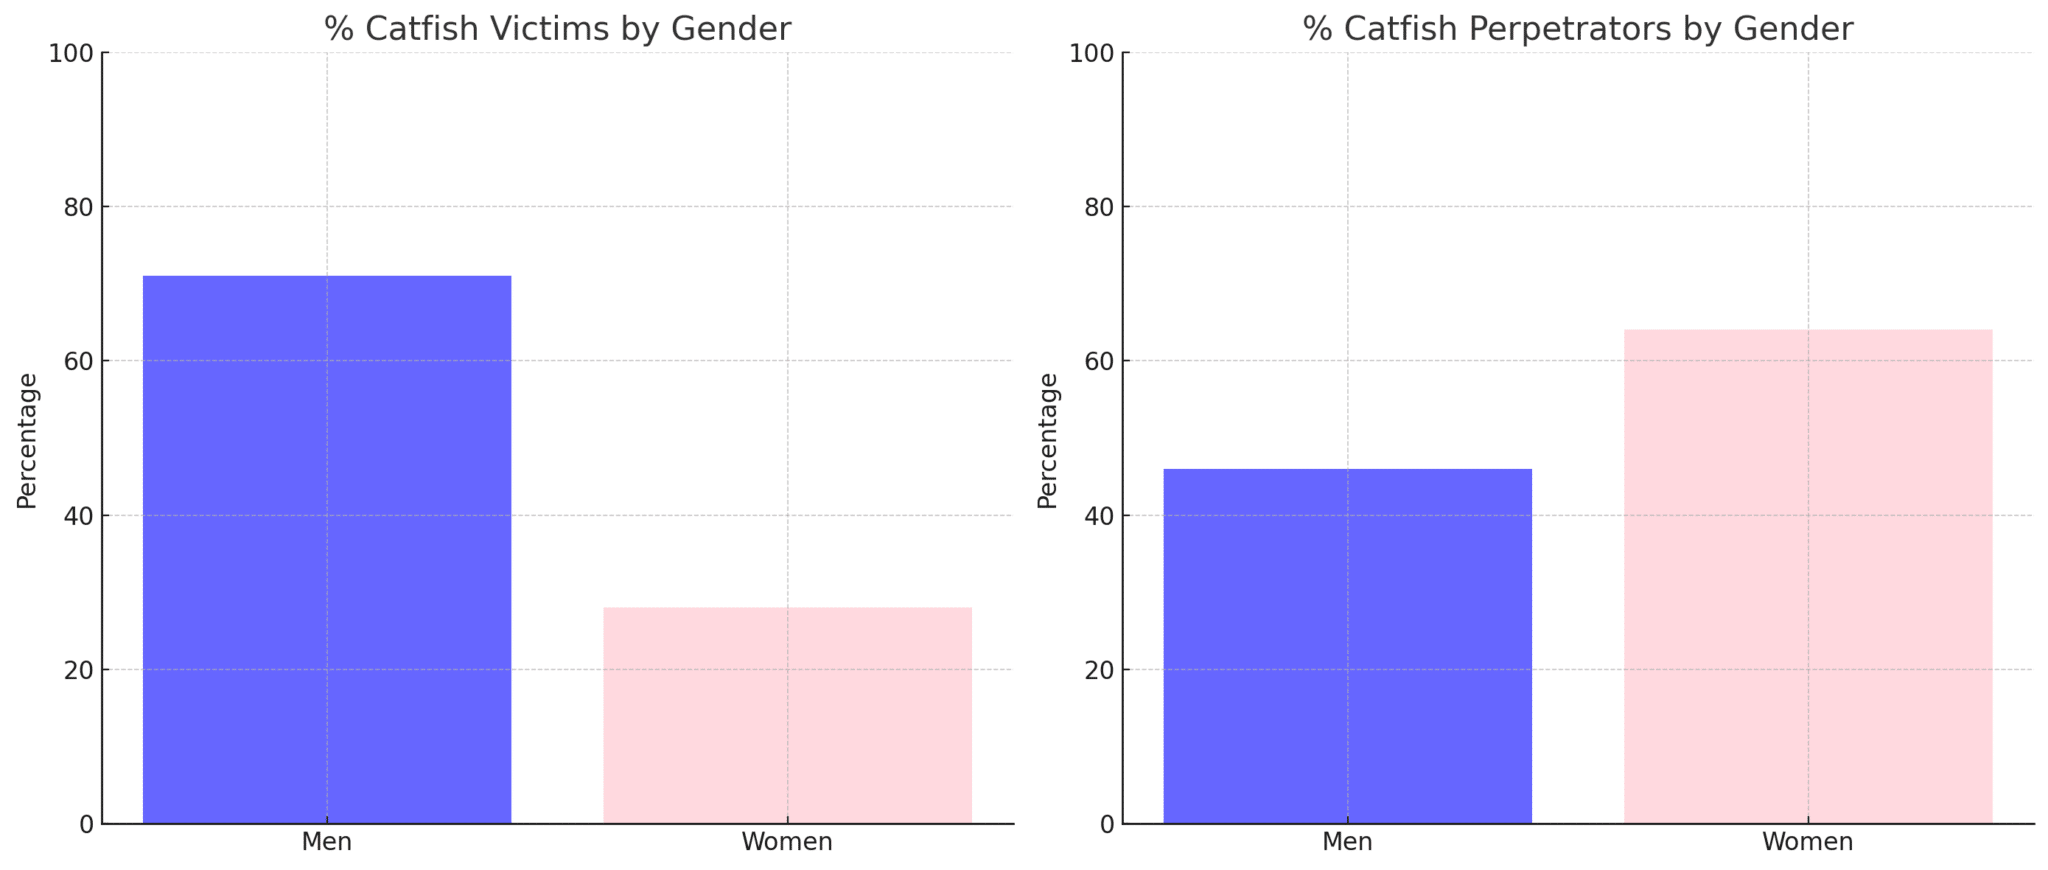
Men are more likely to be victims of catfishing, with 71% of the catfish victims being male, compared to 28% for females.
On the other hand, women are more likely to be the perpetrators, with 64% of catfish perpetrators being female, compared to 46% for males.
Likelihood of Fall for a Catfishing Attempt by Gender
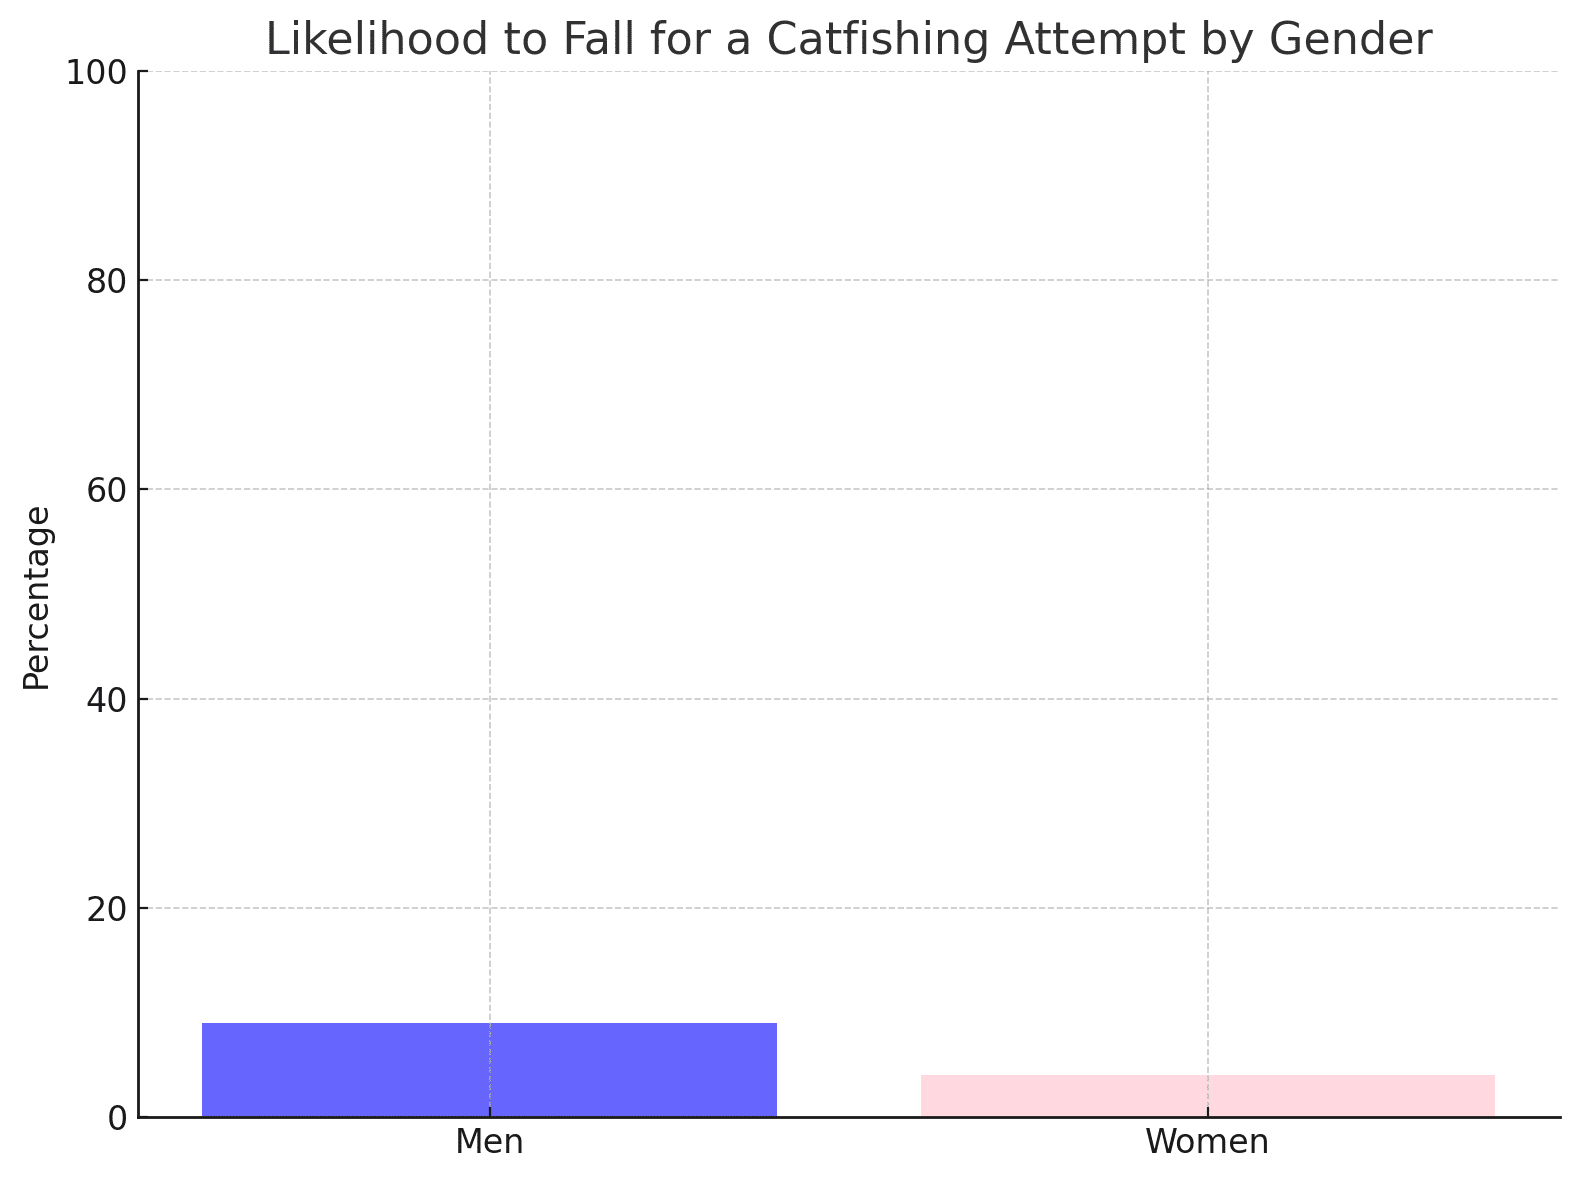
Men are more likely to fall for a catfishing attempt, with a likelihood of 9%, compared to 4% for women.
Percentage of Victims Sending Nudes by Gender
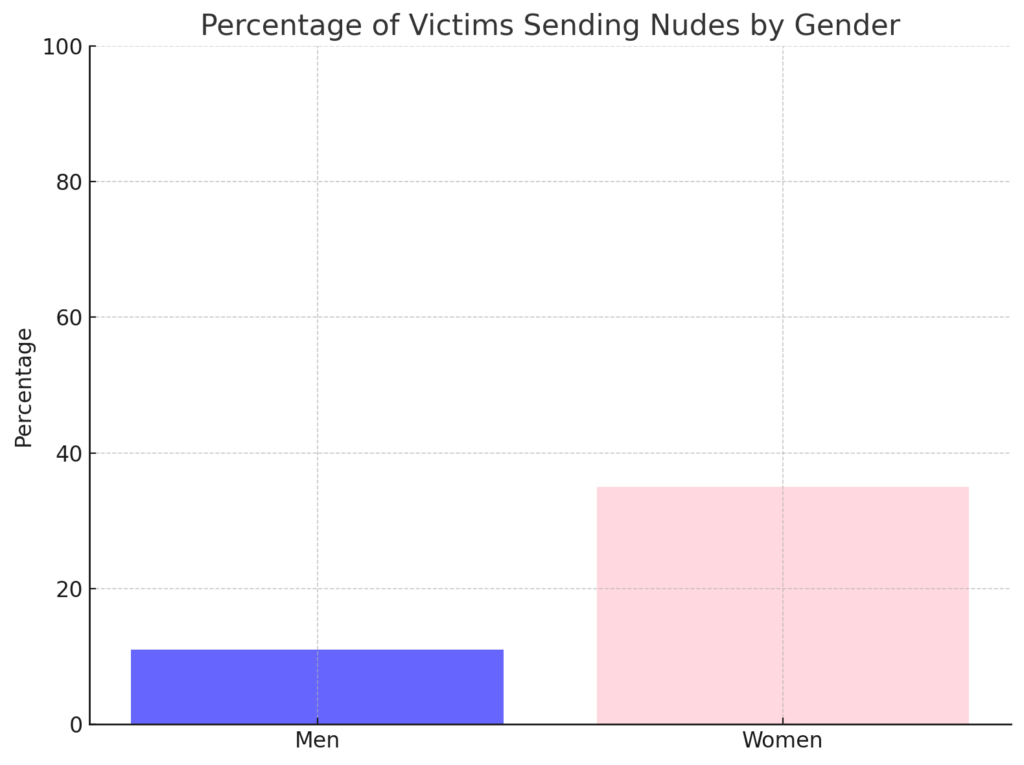
Women are more likely to send nude pictures during a catfishing scam, with 35% of female victims doing so, compared to 11% of male victims.
Percentage of Victims Sending Money by Gender
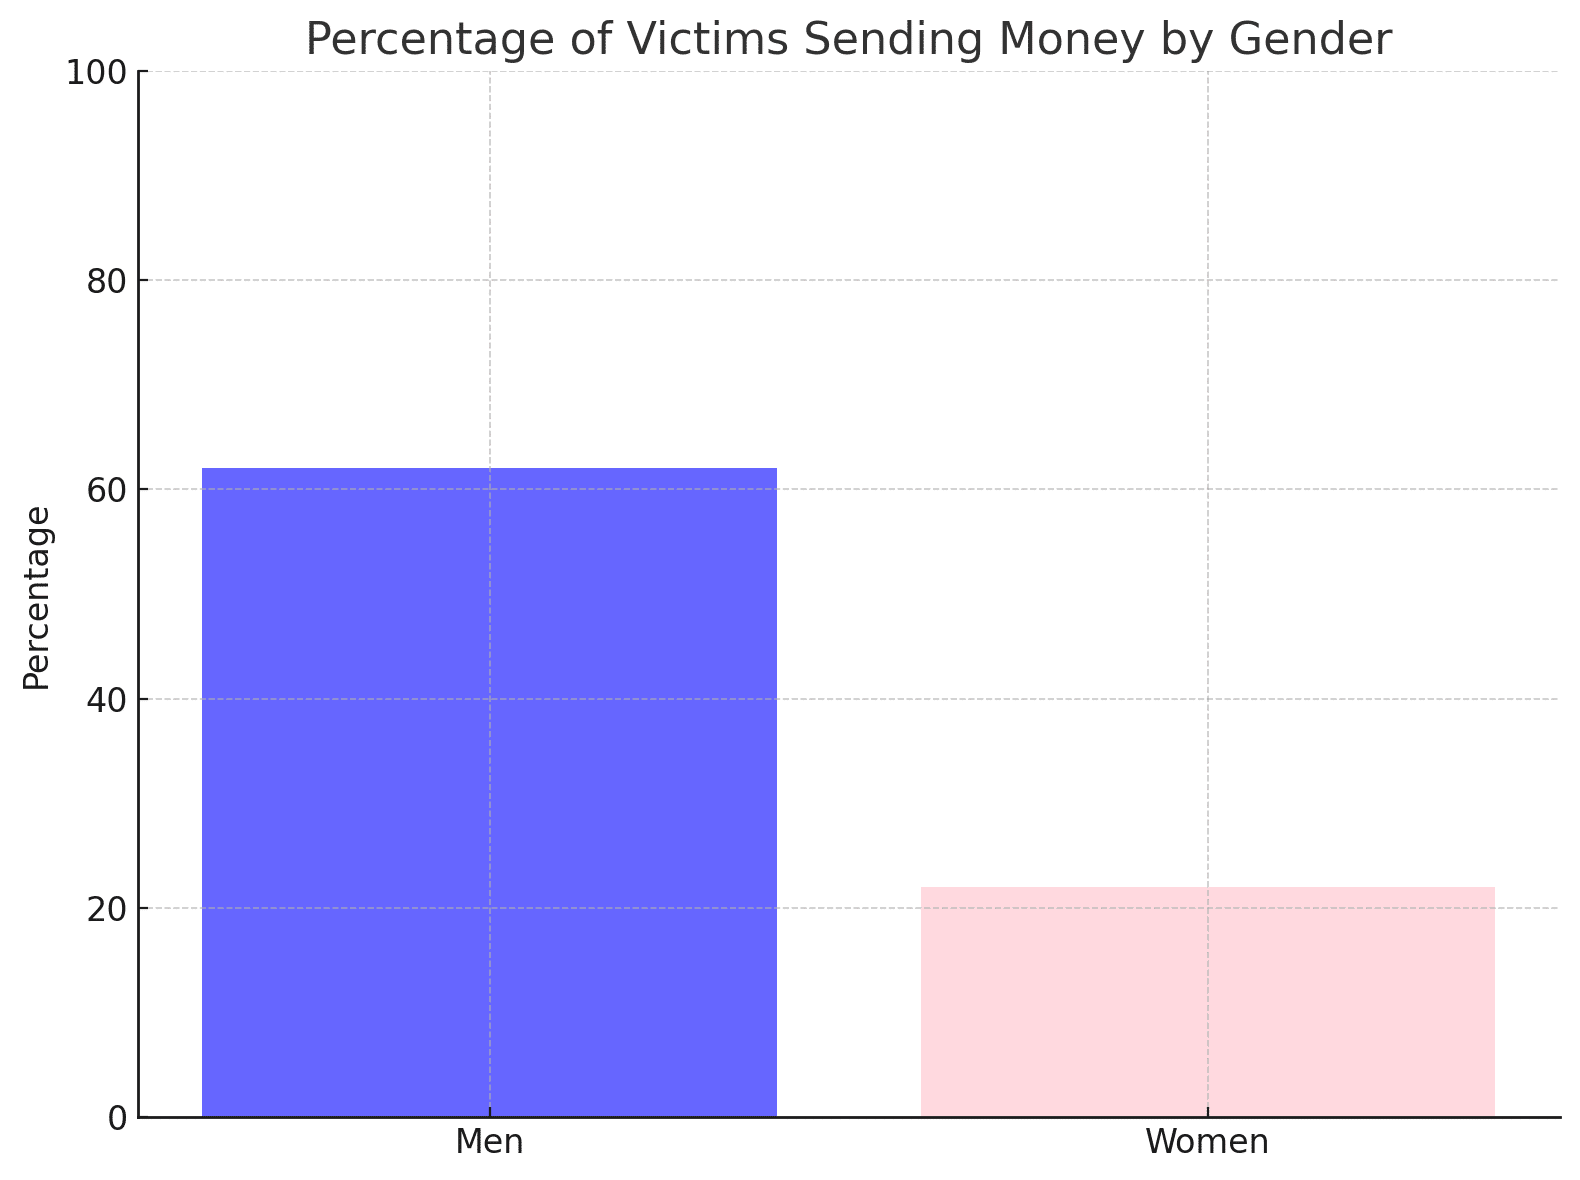
Men are significantly more likely to send money during a catfishing scam, with 62% of male victims doing so, compared to only 22% of female victims.
All data
| Men | Women | |
|---|---|---|
| % Catfish victims | 71% | 28% |
| % Catfish perpetrators | 46% | 64% |
| – | – | – |
| Likelihood to fall for attempt | 9% | 4% |
| % of victims sent nude | 11% | 35% |
| % of victims sent money | 62% | 22% |
Attempted catfishing and outcomes, by gender
- Men are more likely to attempt to get catfished and are more likely to become victims compared to women.
- A vast majority of individuals who tried to get catfished did not fall for it. Among those, most reported no harm done, with women feeling safer than men.
- Among the victims, women experienced stronger negative emotions such as humiliation and heartbreak. However, both genders reported mental health issues at comparable rates due to catfishing incidents.
Distribution of Individuals Who Tried to Get Catfished by Gender
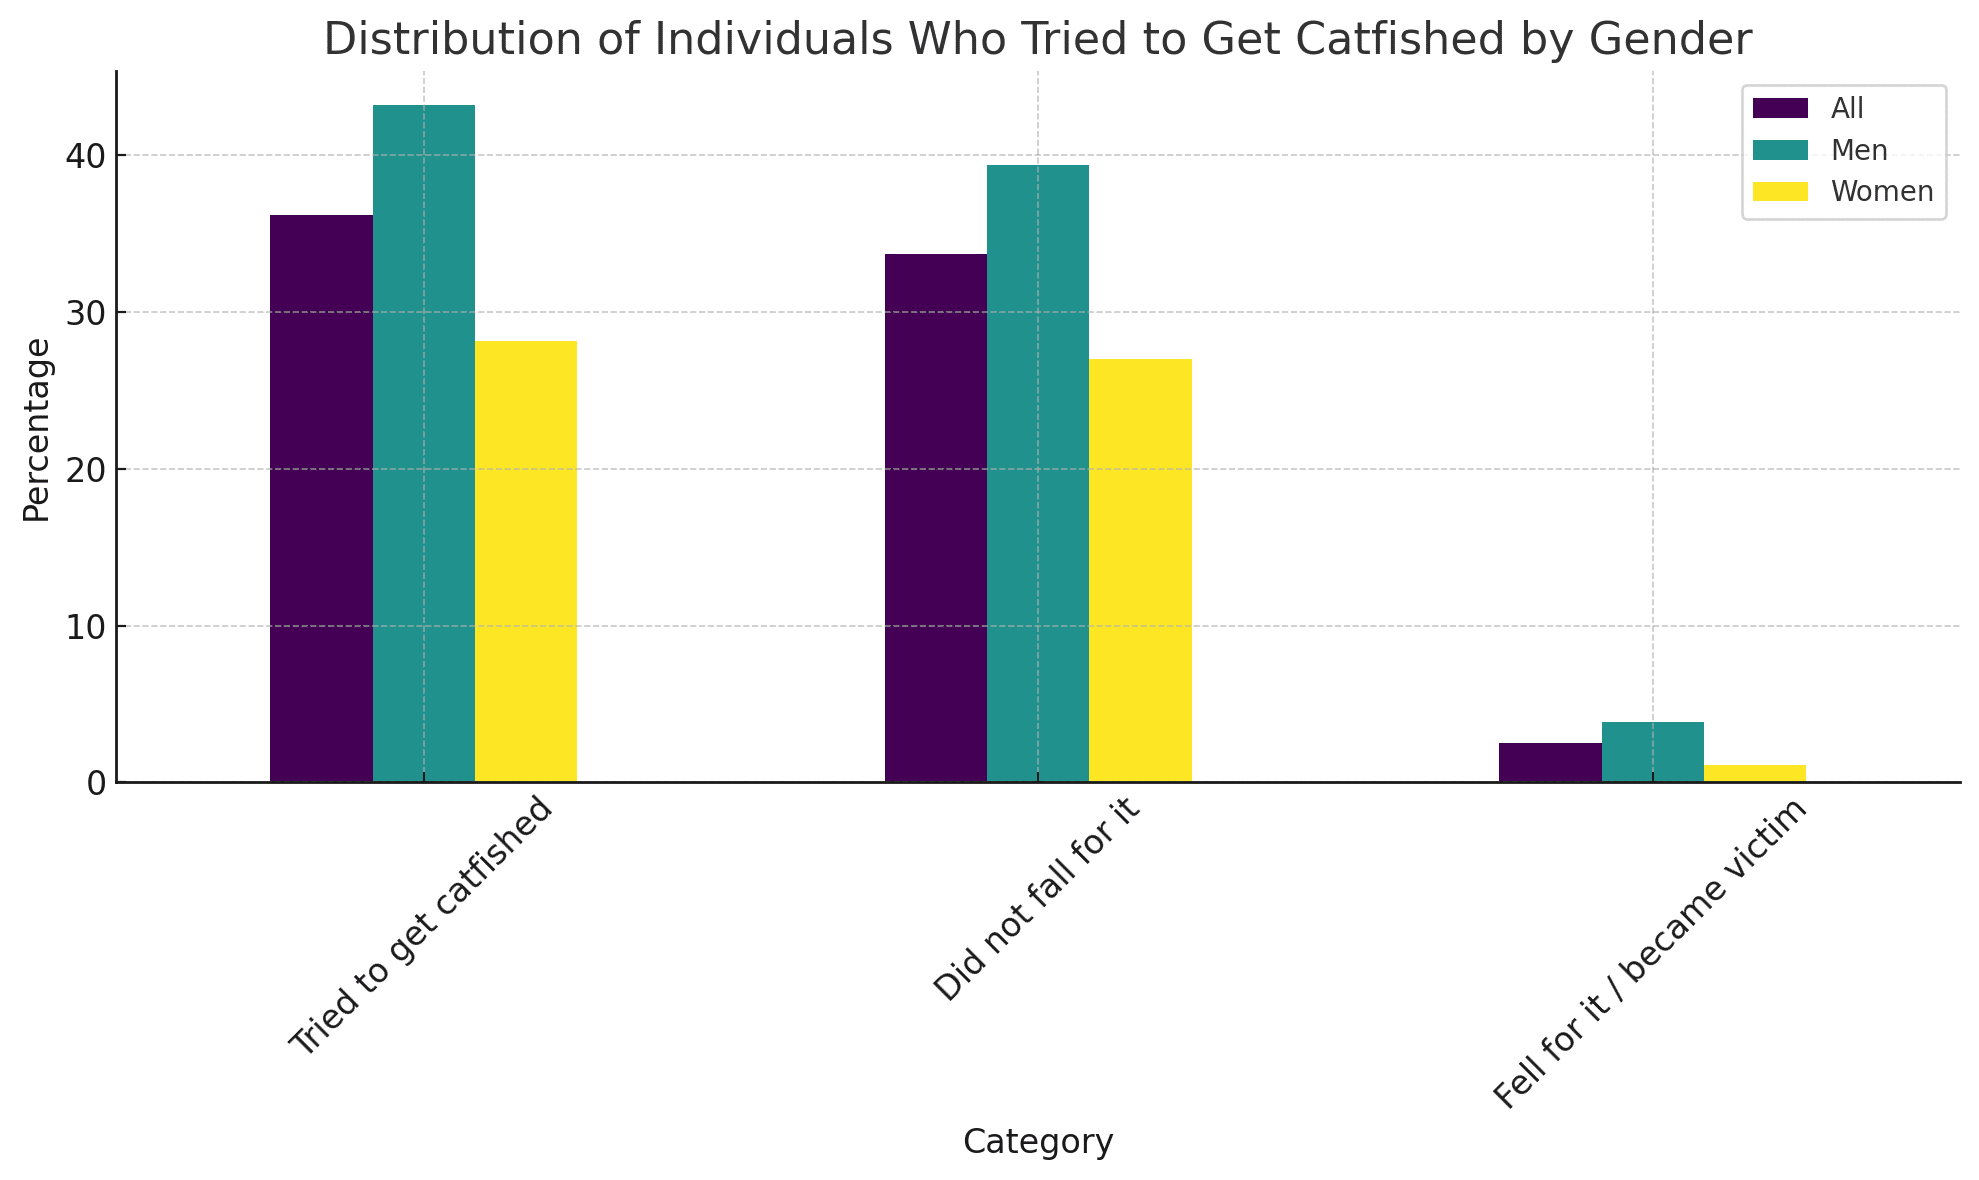
Men have a higher percentage (43.22%) of individuals who tried to get catfished compared to women (28.14%).
When considering both genders (All), the percentage is 36.17%.
While a significant portion of both genders attempted to get catfished, a much smaller percentage fell for the scam. Men (3.87%) are more likely to become victims compared to women (1.12%).
Outcomes for Those Who Did Not Fall for It
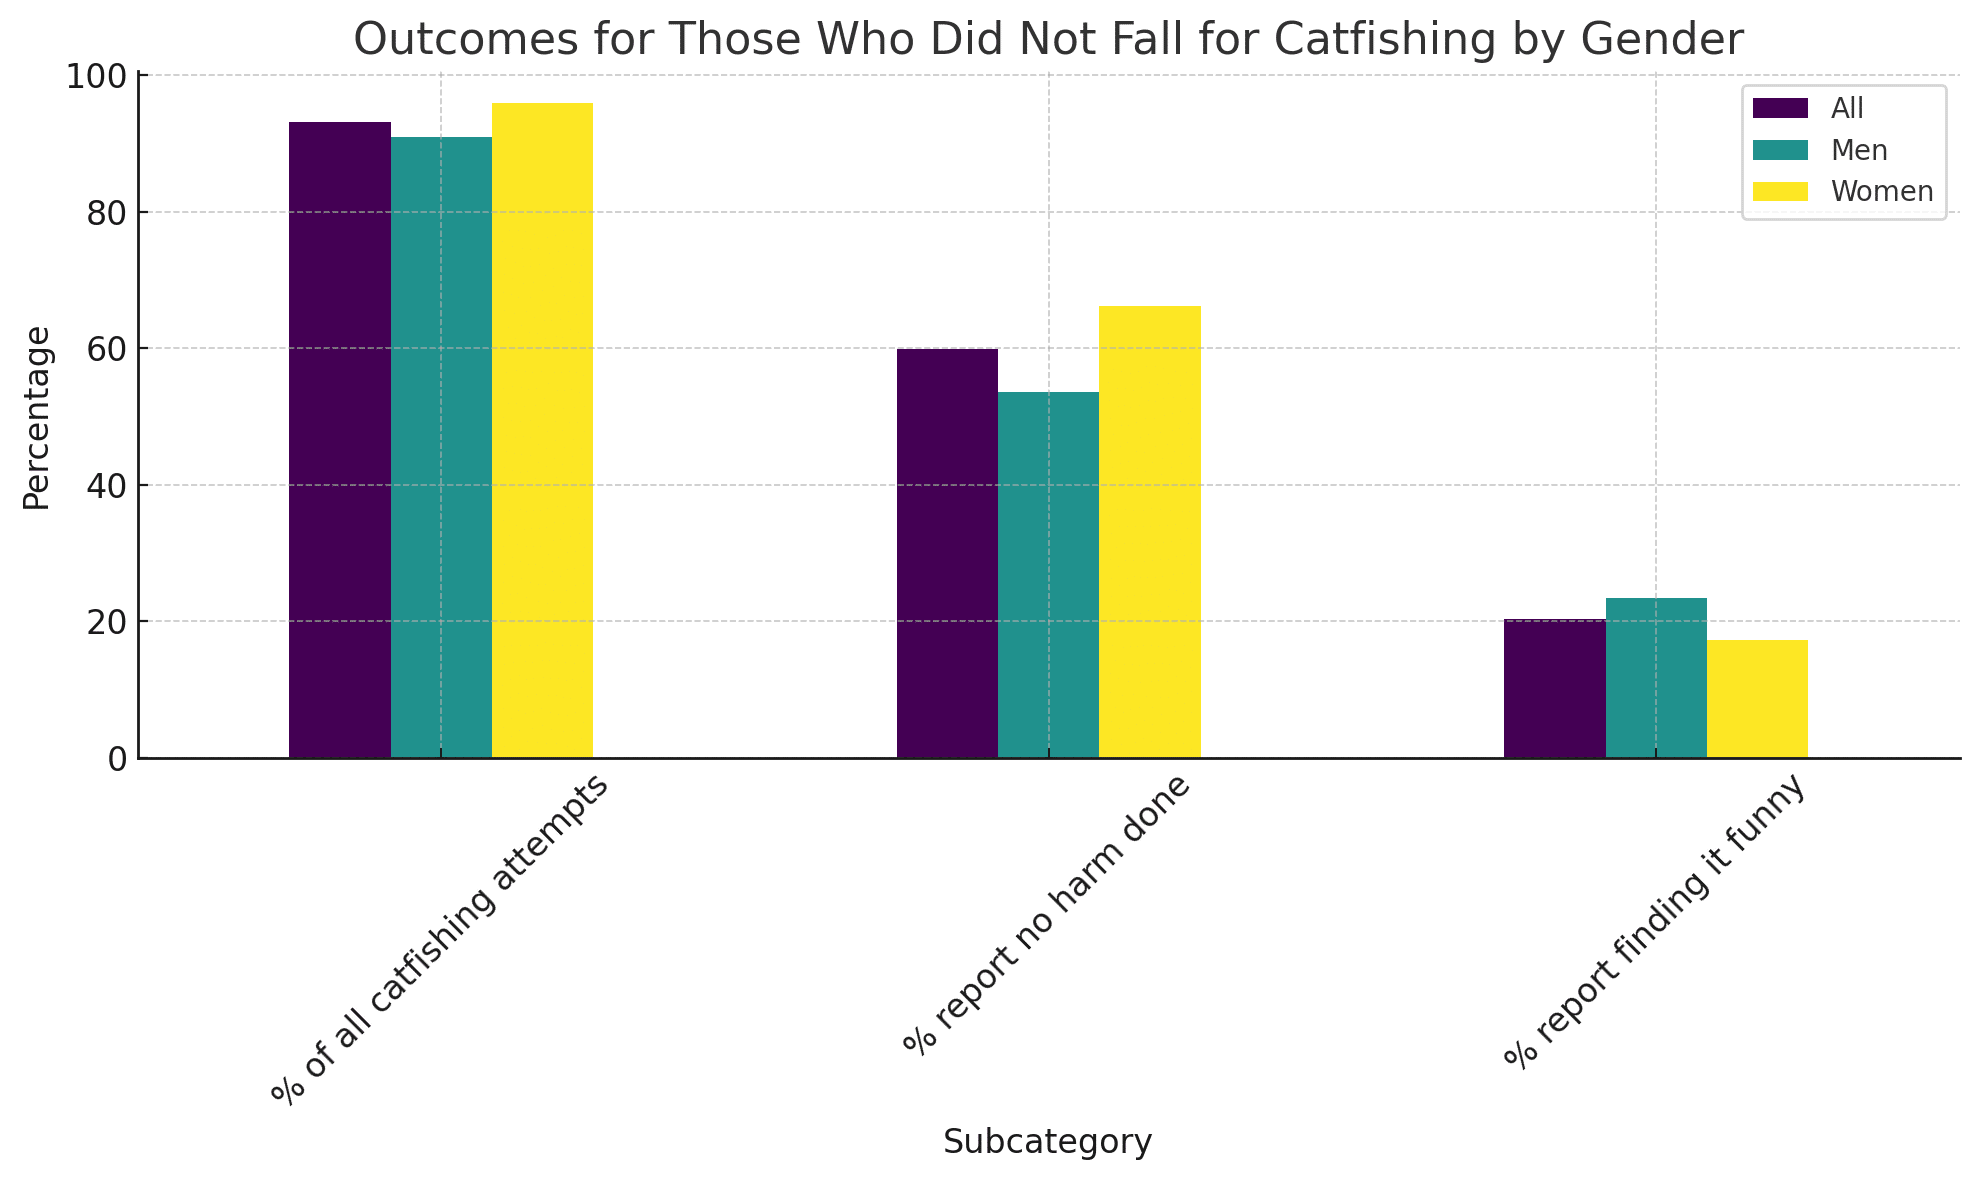
A vast majority of those who tried to get catfished did not fall for it, with approximately 93.12% for all participants, 90.92% for men, and 95.83% for women.
When considering the individuals who did not fall for the catfishing attempt:
59.88% of all participants reported no harm done. This sentiment is stronger among women (66.11%) compared to men (53.61%).
20.35% of all participants found the catfishing attempt funny. Men (23.48%) were slightly more amused than women (17.21%).
Outcomes for Those Who Fell for the Catfishing Attempt
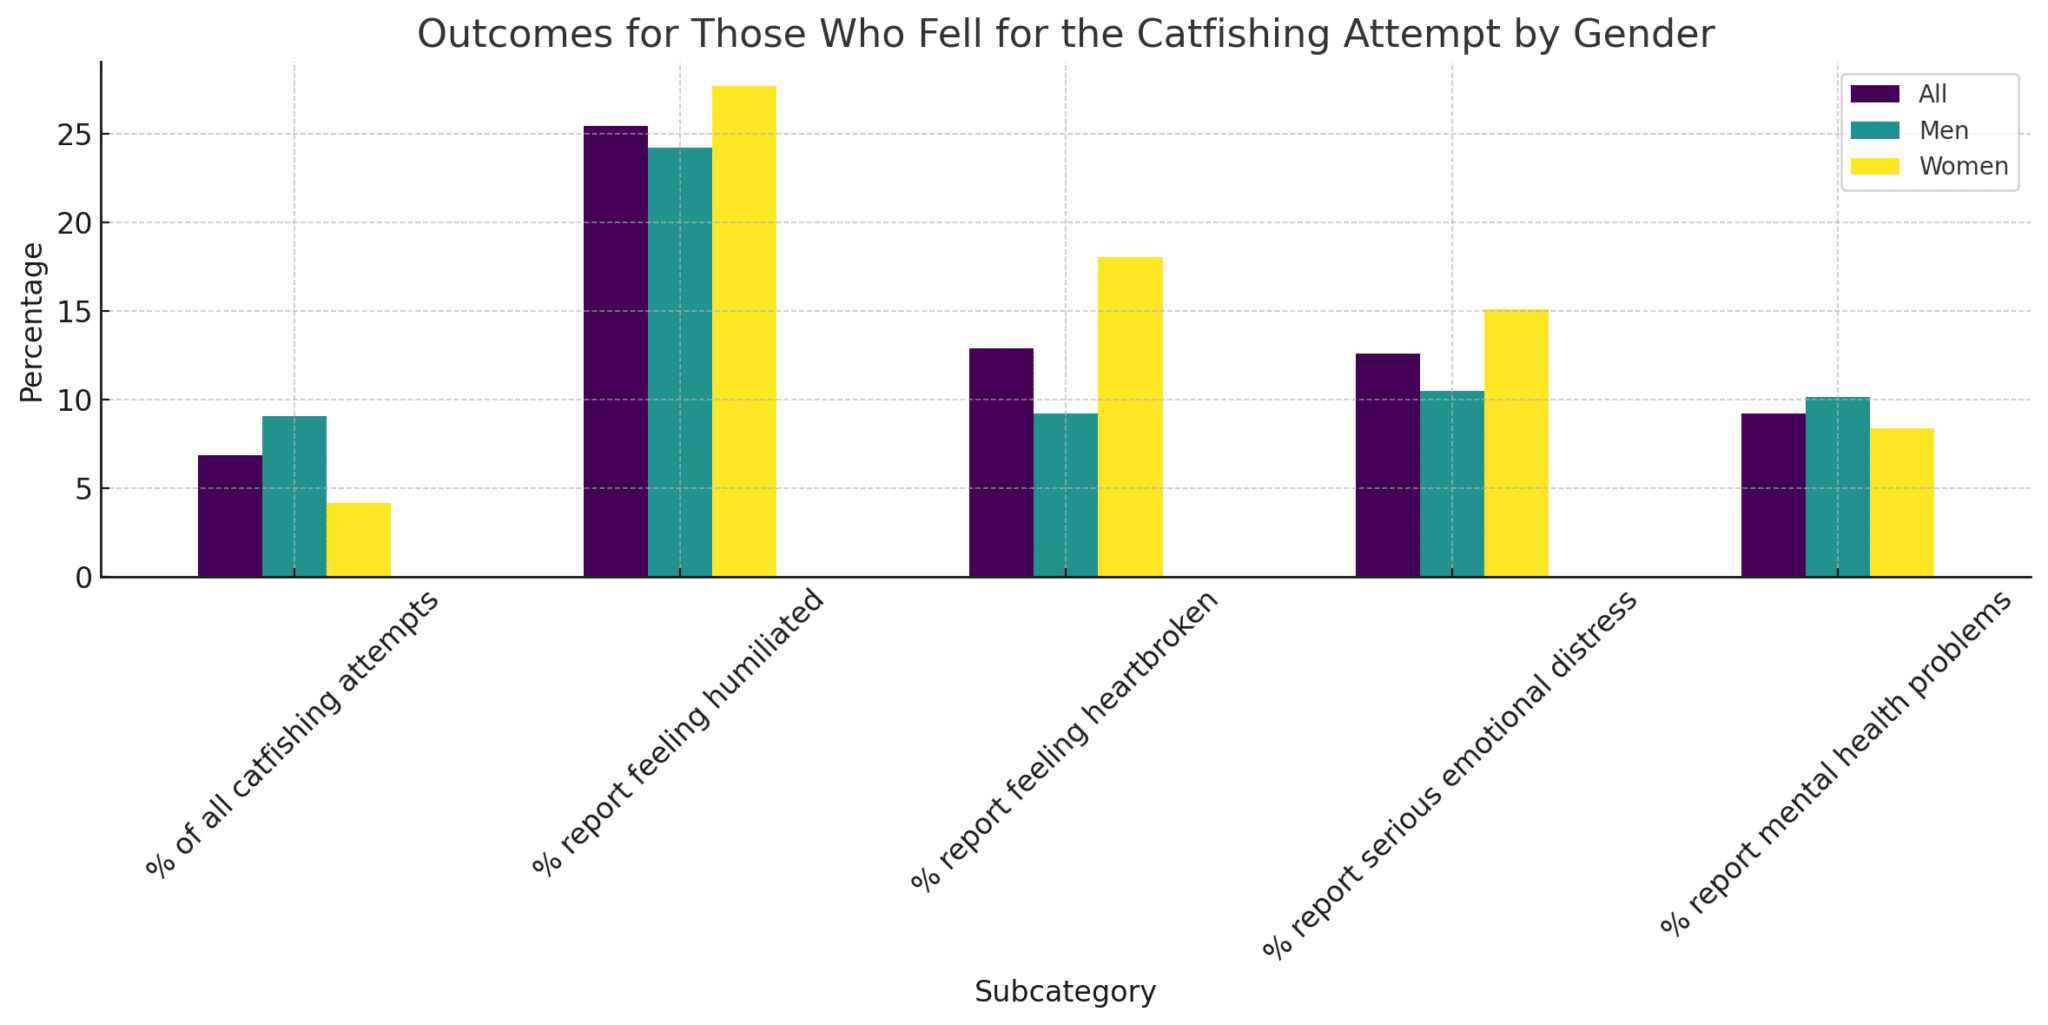
Of those who tried to get catfished, a minority fell for it, making up 6.88% of all participants, 9.08% of men, and 4.17% of women.
Among the victims
- 25.42% of all participants reported feeling humiliated. The sentiment was slightly stronger among women (27.69%) than men (24.22%).
- Heartbreak was experienced by 12.89% of all participants. Women (18.05%) reported a higher rate of feeling heartbroken compared to men (9.21%).
- Serious emotional distress was reported by 12.58% of all participants. Here, women (15.10%) felt more distressed than men (10.48%).
- 9.22% of all participants reported mental health problems due to the catfishing incident. The rates were fairly close between men (10.14%) and women (8.38%).
Overview of the data
| All | Men | Women | |
|---|---|---|---|
| Tried to get catfished | 36.17% | 43.22% | 28.14% |
| – | – | – | – |
| Did not fall for it | 33.68% | 39.35% | 27.02% |
| : % of all catfishing attempts | 93.12% | 90.92% | 95.83% |
| : % report no harm done | 59.88% | 53.61% | 66.11% |
| : % report finding it funny | 20.35% | 23.48% | 17.21% |
| – | – | – | – |
| Fell for it / became victim | 2.49% | 3.87% | 1.12% |
| : % of all catfishing attempts | 6.88% | 9.08% | 4.17% |
| : % report feeling humiliated | 25.42% | 24.22% | 27.69% |
| : % report feeling heartbroken | 12.89% | 9.21% | 18.05% |
| Fell for it / became a victim | 12.58% | 10.48% | 15.10% |
| : % report mental health problems | 9.22% | 10.14% | 8.38% |
Previous studies have no clear answer
Studies, surveys, and other data available on catfishing points in multiple directions:
- A survey by the UK-based cybersecurity company Norton found that one in four people have fallen victim to catfishing.
- The same survey found that one in six people have been asked for money by someone they met online.
- A study by the University of Wisconsin-Madison found that 81% of online daters have lied about their height, weight, or age in their online dating profile.
- A 2018 survey by the Australian Psychological Society found that 15% of Australians have been victims of catfishing.
- A survey by the dating website Zoosk found that 60% of people have been victims of a catfishing scam.
- In a survey of 1,000 users of dating apps, conducted by the research firm Opinium, 20% of respondents said they had been catfished.
- A study by the Pew Research Center found that 81% of Americans believe that online dating is a good way to meet people, but 55% of Americans also believe that people lie on online dating profiles.
- The Federal Bureau of Investigation (FBI) reports that online romance scams account for the highest financial losses of all internet-facilitated crimes, with individuals losing an average of $2,600.
- In a survey of 1,500 dating app users, conducted by the research firm GlobalWebIndex, around 42% of online daters said they had been contacted by someone through a dating app or website in a way that made them feel harassed or uncomfortable.
- A 2018 study by the UK’s National Fraud Intelligence Bureau found that 3,889 victims lost a total of £39m ($51m) in online dating scams in the previous year, an increase of 32%.
- A survey by the Better Business Bureau (BBB) found that one in 10 online dating profiles are fake.
Albeit not all the different studies and surveys have directly contradictory findings they do shine a light on the lack of consistent results in the area.
With this study, we have attempted to rid this issue and give the most accurate estimate on how common catfishing is – both in terms of how many suffer from it and how many actively try and catfish others.