![Condom Market Size [Facts, Figures & Numbers]](https://wp.bedbible.com/wp-content/uploads/2024/04/Condom-Market-Size-Facts-Figures-and-Numbers.png)
The condom industry is in rapid development where sales and revenue are increasing. Something good for the world’s general health since it reduces the spread of HIV and other STIs.
This report seeks to give a full overview of the condom industry. You’ll find information on; Industry Revenue, Forecasted growth, Market Share and – size, The pandemic’s impact, and information about the largest condom companies.
In this statistic, you’ll find:
- Global Market Size (in billion USD)
- US Market Size (in billion USD)
- Number of condoms sold worldwide, by year
- Number of condoms sold in the US, by year
- Market Share by Region
- Market Share by Distribution Channel
- Market Share by Company
- COVID-19 Impact on Condom Sales
Key Findings
- $8.86 billion is the Global Market Size for Condoms in 2023 ($9.36 billion in 2024)
- $1.65 billion is the USA Market Size for Condoms in 2023 ($1.79 billion in 2024)
- A CAGR of 8.52% is expected from 2022 to 2030.
- 91% of the Condom Sales are Male Condoms. Only 9% comes from Female Condoms.
- In 2030 the Global Condom Market Size is expected to be $13.06 billion (The US Market Size in 2030 is estimated to reach $2.92 billion)
- 15.28 billion condoms were sold in 2023 Globally
- 1.65 billion condoms were sold in 2023 in the USA
- The average cost for a condom in the US is 1$ and $0.58 globally
- Market Share: Asia is the biggest market for condoms. 50% of the sales happen in Asia (Compared to 12.5% in the USA).
- Market Share: 32.5% of condoms are sold in Drug Stores/Pharmacies, 12.5% in online retail stores, 22.5% in Physical Stores, and 32.5% in Mass Merchandisers (B2B Stores).
- Market Share: The 3 biggest condom companies are: Reckitt Benckiser Group PLC, Church & Dwight Company, and Pharmacy: Walgreens Boots Alliance, INC (WBA).
Condom Industry Revenue and Market Size: 2015 to 2030
The market for condoms is increasing and has been increasing for many years.
Some of the reasons for this are:
- The general wealth on earth is rising, which means that poorer countries prioritize “protecting” themselves. These are just some of the explanations.
- Another explanation is that more and more started to use female condoms. Because the companies have produced a product which is almost as good as other alternatives.
- More diversified products. This in other words means that the supply matches the demand. A good example is the creation of female condoms but also small condoms for a snugger fit. But also condoms to enhance the feeling for women.
- More awareness of the products. The government uses the money to “educate” its citizens. And some even send them for free. See which state in our “fun facts about condoms” further down in this report.
Global Market Size (in billion USD)
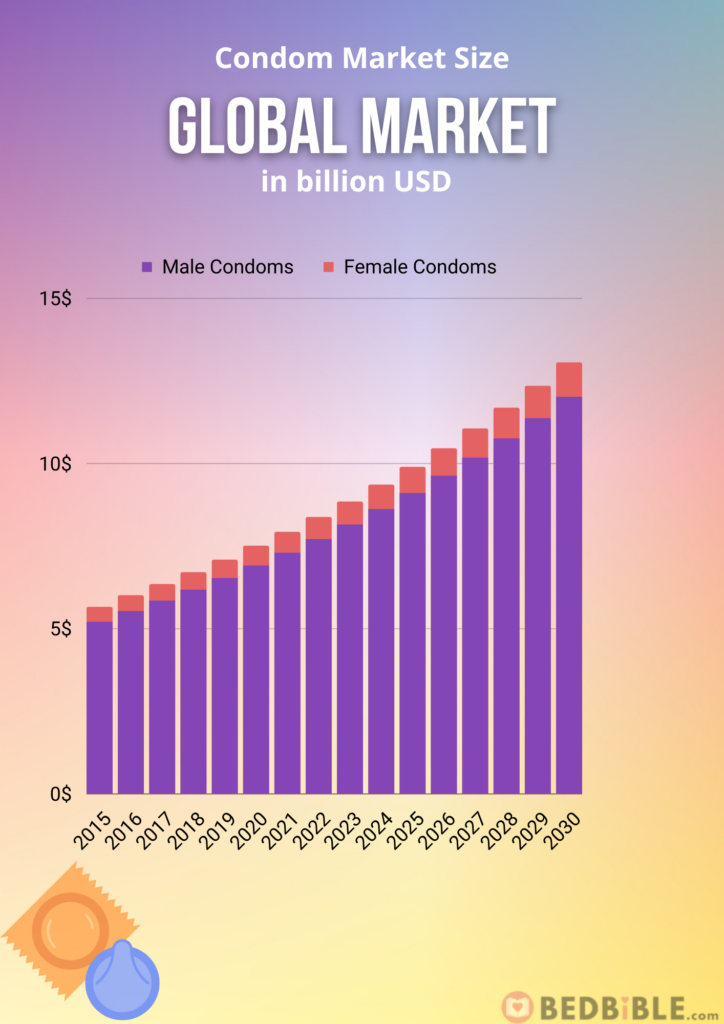
| Year | Total | Male condoms | Female condoms |
| 2015 | 5.9 | 5.2 | 0.45 |
| 2016 | 6.0 | 5.5 | 0.48 |
| 2017 | 6.4 | 5.8 | 0.51 |
| 2018 | 6.7 | 6.2 | 0.54 |
| 2019 | 7.1 | 6.5 | 0.57 |
| 2020 | 7.5 | 6.9 | 0.60 |
| 2021 | 7.9 | 7.3 | 0.63 |
| 2022 | 8.4 | 7.7 | 0.67 |
| 2023 | 8.9 | 8.2 | 0.71 |
| 2024 | 9.4 | 8.6 | 0.75 |
| 2025 | 9.9 | 9.1 | 0.79 |
| 2026 | 10.5 | 9.6 | 0.84 |
| 2027 | 11.0 | 10.2 | 0.88 |
| 2028 | 11.7 | 10.8 | 0.93 |
| 2029 | 12.4 | 11.4 | 0.99 |
| 2030 | 13.0 | 12.0 | 1.04 |
As you can see above is the global condom market increasing, and forecasted to continue doing that.
As you can see from the condom sales statistics by year; It’s still the male condoms that dominate the sales compared to the market size of female condoms. Male condoms cover 92% of the market and female condoms the rest 8%. It though expected that female condoms will exponentially increase if companies manage to keep the development of the product. Female condoms are right now in a spot, where substitution products can take over if consumers think they are better.
For male condoms there is a big variety, you can find condoms for sensitive skin or ribbed ones.
The numbers from 2015 to 2021 are realized numbers, whereas numbers from 2022 to 2030 are forecasted numbers with a CAGR of 8.52% (Compound Annual Growth Rate). The 8.52% is chosen on behalf of what surveys say about demand/supply, expected technology within product development, and world economics. 8.52% is a conservative CAGR compared to other available reports. In the financial world, you would place this chosen CAGR between worst-case and best-case scenarios. So not the CAGT if everything goes better than expected, but not also if everything ends in the worst case.
To compare the global condom market with another global market we’ve here listed a few, so you get an idea about how big the market is:
Condom market size by 2030: 13.06 billion USD
Sex toy market size by 2030: 65 billion USD
Athletic Footwear market size: 196 billion USD
US Market Size (in billion USD)
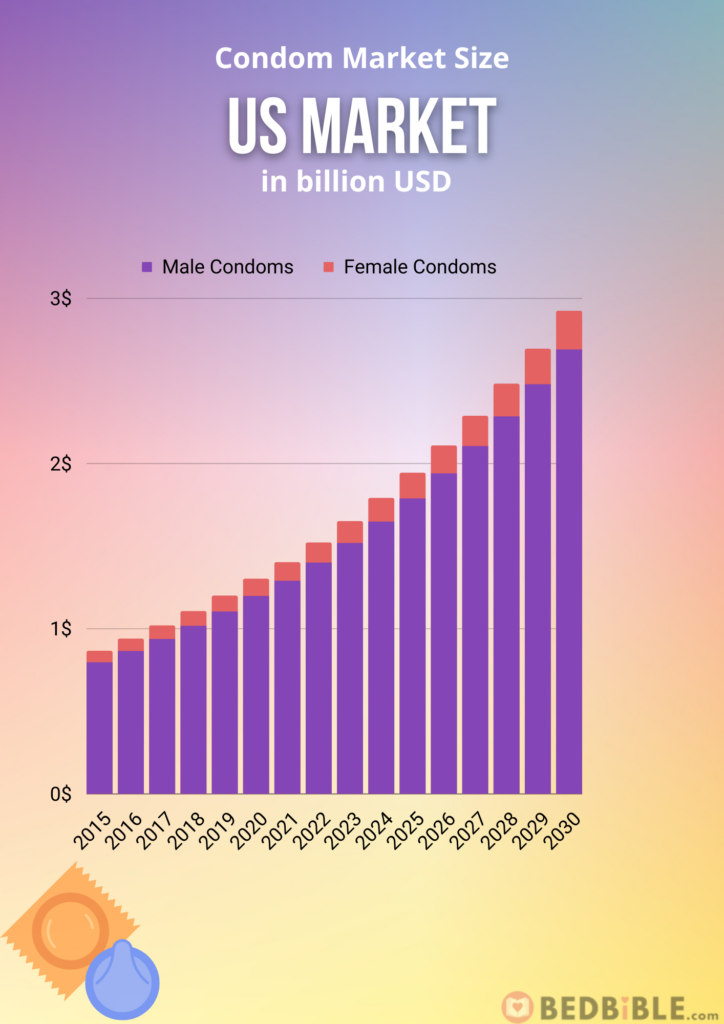
| Year | Total | Male condoms | Female condoms |
| 2015 | 0.86 | 0.79 | 0.07 |
| 2016 | 0.94 | 0.86 | 0.07 |
| 2017 | 1.0 | 0.94 | 0.08 |
| 2018 | 1.1 | 1.0 | 0.09 |
| 2019 | 1.2 | 1.1 | 0.1 |
| 2020 | 1.3 | 1.2 | 0.1 |
| 2021 | 1.4 | 1.3 | 0.11 |
| 2022 | 1.5 | 1.4 | 0.12 |
| 2023 | 1.7 | 1.5 | 0.13 |
| 2024 | 1.8 | 1.7 | 0.14 |
| 2025 | 1.9 | 1.8 | 0.16 |
| 2026 | 2.1 | 1.9 | 0.17 |
| 2027 | 2.3 | 2.1 | 0.18 |
| 2028 | 2.5 | 2.3 | 0.2 |
| 2029 | 2.7 | 2.5 | 0.22 |
| 2030 | 2.9 | 2.7 | 0.23 |
The market size of North America only covers 12.5 – 17.5% of the total global market. So it’s just to say that condom sales by year are also mentionable in other parts of the world. We’ve found the market share by region in the next section of this report.
As the global sales, so do the US market expect to increase continuously to 2030. The CAGR here is 5.70%. So 2.82% less growth than the global market, but still a significant increase.
Number of condoms sold each year
The condom industry has experienced consistent growth over the years, reflecting the global emphasis on safe sexual practices and health awareness.
Number of condoms sold worldwide, by year
While the market comprises both male and female condoms, the former significantly outpaces the latter in terms of sales volume. The data provided offers a detailed year-by-year estimation of the number of male and female condoms sold worldwide from 2015 to 2030.
These figures are derived from the market values, using an average cost of 58 cents per condom as a reference. The subsequent table and findings present a clear picture of the increasing demand for condoms on a global scale.
Given: Average cost of a condom: $0.58
Calculation: Number of condoms = (Market value for that year in billion USD * 1,000,000,000) / $0.58
Table with data on the number of condoms sold
- By 2030, it is estimated that over 21 billion male condoms and nearly 1.8 billion female condoms will be sold based on the market value.
- In 2015 approximately 9 billion condoms were sold worldwide.
- In 2018 the total number of condoms sold saw an increase to approximately 10.66 billion.
- In 2022 the global sales further rose to approximately 13.29 billion condoms.
- In 2023 the number of condoms sold is expected to reach 14 billion.
- The number of male condoms sold is consistently higher than the number of female condoms sold each year.
- There is a steady increase in the number of both male and female condoms sold from 2015 to 2030.
| Year | Number of Male Condoms Sold | Number of Female Condoms Sold | Total Condoms Sold |
|---|---|---|---|
| 2015 | 9.02 billion | 775.86 million | 9.80 billion |
| 2016 | 9.53 billion | 827.59 million | 10.36 billion |
| 2017 | 10.07 billion | 879.31 million | 10.95 billion |
| 2018 | 10.66 billion | 931.03 million | 11.59 billion |
| 2019 | 11.26 billion | 982.76 million | 12.24 billion |
| 2020 | 11.90 billion | 1.03 billion | 12.93 billion |
| 2021 | 12.57 billion | 1.09 billion | 13.66 billion |
| 2022 | 13.29 billion | 1.16 billion | 14.45 billion |
| 2023 | 14.05 billion | 1.22 billion | 15.28 billion |
| 2024 | 14.84 billion | 1.29 billion | 16.14 billion |
| 2025 | 15.69 billion | 1.36 billion | 17.05 billion |
| 2026 | 16.59 billion | 1.45 billion | 18.03 billion |
| 2027 | 17.53 billion | 1.52 billion | 19.05 billion |
| 2028 | 18.53 billion | 1.60 billion | 20.14 billion |
| 2029 | 19.59 billion | 1.71 billion | 21.30 billion |
| 2030 | 20.71 billion | 1.79 billion | 22.50 billion |
Number of condoms sold in the US, by year
Given: Average cost of a condom in the US: $1
Calculation: Total Number of Condoms Sold = Market value for that year in billion USD * 1,000,000,000 / $1
US Condom Sales Analysis (2015-2030)
- By 2030, it is estimated that over 2.69 billion male condoms and nearly 230 million female condoms will be sold in the US based on the market value.
- In 2015, approximately 860 million condoms were sold in the US.
- In 2018, the total number of condoms sold in the US saw an increase to approximately 1.11 billion.
- In 2022, the US sales further rose to approximately 1.52 billion condoms.
- In 2023, the number of condoms sold in the US is expected to reach 1.65 billion.
- The number of male condoms sold in the US is consistently higher than the number of female condoms sold each year.
- There is a steady increase in the number of both male and female condoms sold in the US from 2015 to 2030.
| Year | Number of Male Condoms Sold | Number of Female Condoms Sold | Total Condoms Sold |
|---|---|---|---|
| 2015 | 790 million | 70 million | 860 million |
| 2016 | 860 million | 70 million | 930 million |
| 2017 | 940 million | 80 million | 1.02 billion |
| 2018 | 1.02 billion | 90 million | 1.11 billion |
| 2019 | 1.1 billion | 100 million | 1.2 billion |
| 2020 | 1.2 billion | 100 million | 1.3 billion |
| 2021 | 1.3 billion | 110 million | 1.41 billion |
| 2022 | 1.4 billion | 120 million | 1.52 billion |
| 2023 | 1.52 billion | 130 million | 1.65 billion |
| 2024 | 1.65 billion | 140 million | 1.79 billion |
| 2025 | 1.79 billion | 160 million | 1.95 billion |
| 2026 | 1.94 billion | 170 million | 2.11 billion |
| 2027 | 2.10 billion | 180 million | 2.29 billion |
| 2028 | 2.28 billion | 200 million | 2.48 billion |
| 2029 | 2.48 billion | 220 million | 2.7 billion |
| 2030 | 2.69 billion | 230 million | 2.92 billion |
Condom Market Share
The condom market is huge and is only increasing on a year-by-year basis. To get a better understanding of how big it is. We’ve below grouped by region and distribution channel. We’ve analyzed the different regions of the world, to show where the sales of condoms happen the most, and further looked at the distribution channels, to better understand the buying behavior of the consumers. Lastly, we’ve tried to list the biggest condom companies.
By Region
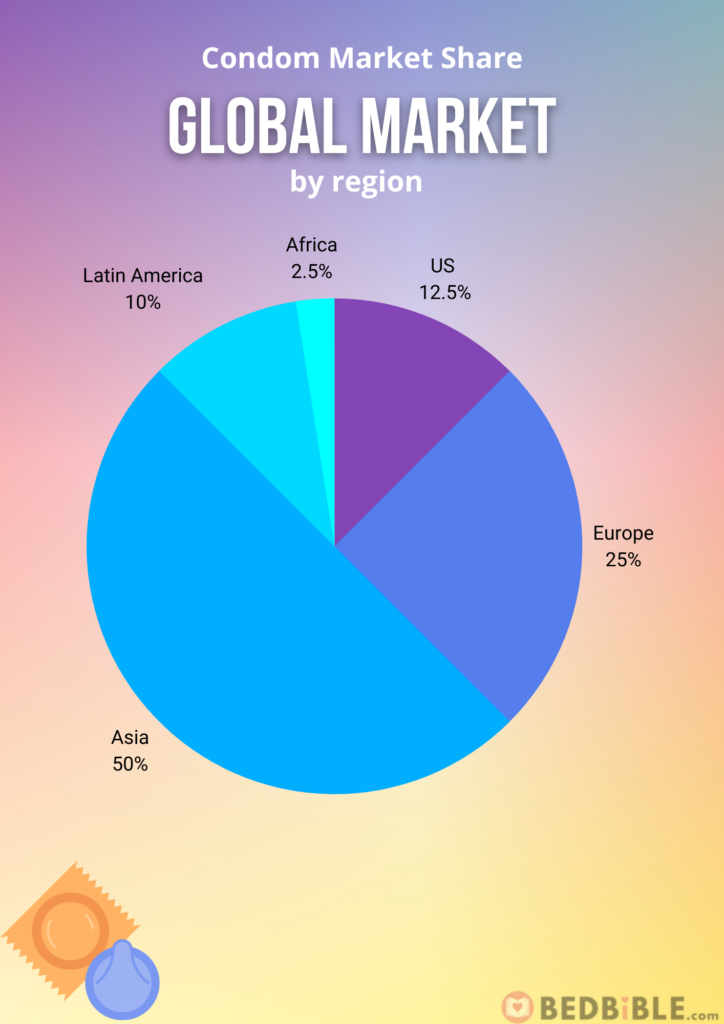
Asia (50%) is the biggest market for condoms. 50% of all condoms are sold in this region. This is super concentrated if we compare market shares to other industries. The reason for this is primarily that the demand in countries such as; India, China, and Japan is increasing a lot, due to richer countries where governments seriously prioritizing educating the inhabitants to understand that it’s important to protect themselves.
USA/North America (12.5%) is one of the markets that’s expected to have a bigger market share than they have. The reason that their market share is a bit lower than you probably expect is that competing alternatives to condoms are starting to become popular (e.g. spiral (typically couples that use this) and female condoms)).
Europe (25%) has more inhabitants than the US/North America, which of course also affects the market share. Further Europe has for many years been leading in this area, which means that it’s super normal for people to use it. And something all know what is, and why it’s important to use.
Latin America (10%) is an area that is expected to increase more than the CAGR for the other areas in the coming years. This is part of the developing countries when we talk about growth in sales of condoms. The primary reason for this is that they start to focus more and more on how important it is to keep STIs (sexually transmitted diseases) down.
Africa (2.5%) same story as Latin America.
By Distribution Channel
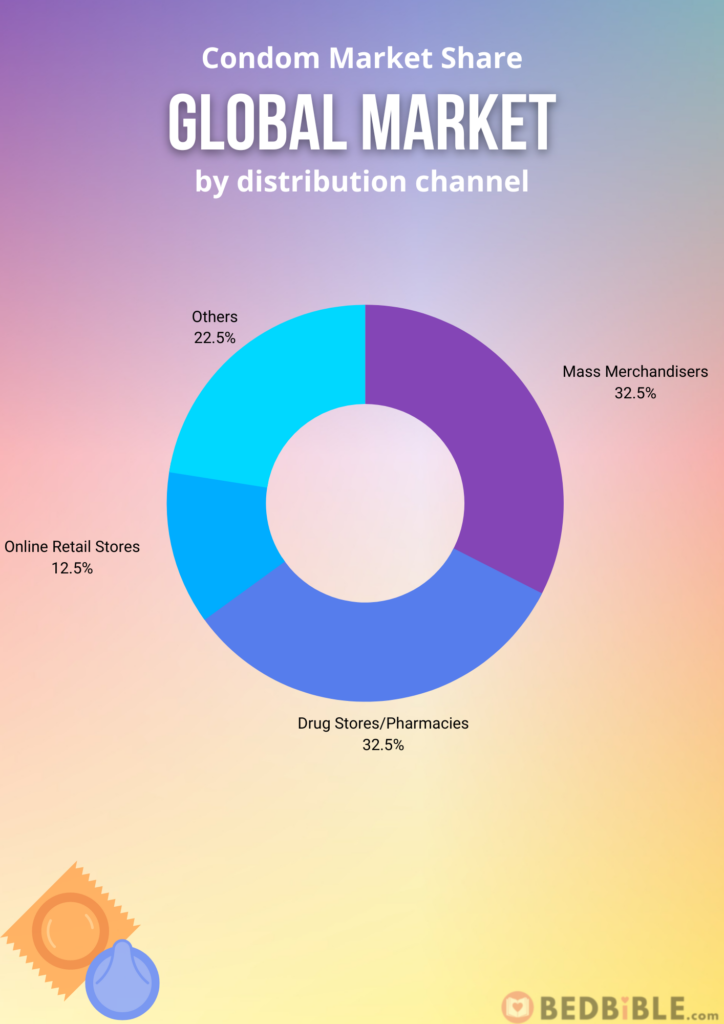
The condom industry is one of them where the majority is buying the products in stores more than online. The reason for this is that condoms are typically a product you’re not buying before you know that you’ll use them. That is what buying behavior surveys say.
But we’re seeing development in this area. Online is expected to grow more and more in the coming years. People start to buy it as a supplement to when they e.g. buy sex toys.
Drug Stores/Pharmacies (32.5%) could be Walmart and Walgreens.
The online Retail Store (12.5%) could be: Lovehoney.com
Others (22.5%) could be: AdamandEve physical stores
Mass Merchandisers (32.5%) could be: Big B2B stores that sell condoms in large quantities
By Company (Condom Stocks: Public traded companies)
Here are the biggest publicly traded companies that sell/produce condoms. These are some major players that have some of the biggest condom brands in the world.
So if you want to diversify your investment portfolio with condom brands. You should do some due diligence on the companies below.
Reckitt Benckiser Group PLC

Is a company from Great Britain traded on the London Stock Exchange called (RKT). They are the owners of the popular condom brand: Durex.
In 2021 they had a Group revenue of 13 billion USD.
Church & Dwight Company

A company with a domicile in the US. Traded on the New York Stock Exchange. They are the owners of the condom brand called: Trojan condoms.
In 2021 they had a Group Revenue of 5.91 billion USD.
Pharmacy: Walgreens Boots Alliance, INC (WBA)

You can also invest in big pharmacies such as Walgreens. Which is one of the biggest pharmacies in the US. With physical stores around the whole country.
Is a way to invest indirectly in condoms, so if you want a more heavy exposure. You should pick one of the two companies introduced before.
Walgreens is an American company. Listed on Nasdaq.
In 2021 they had a revenue of 132.5 billion USD:
Other condom brands in the USA (not-public traded key companies)
If you’re not looking to invest, but just want an overview of some of the world’s key companies selling condoms. Here’s a list of 7 of some of the biggest in the world together with the three mentioned above.
- Fuji Latex Co., Ltd
- Karex Berhad
- Lelo
- Lifestyles Healthcare Ptc. Ltd.
- Cupid Ltd.
- ONE condom
- Sagami Rubber Industries Co., Ltd.
The Pandemic (COVID-19) Impact on Condom Sales
The COVID-19 pandemic did affect condom sales. Sales decreased due to the social distancing that all countries required/suggested. Only countries in Asia saw increases such as India.
While the companies suddenly saw a mentionable drop in demand, the companies spend their time wisely and started to improve/optimize processes and the product (disruption). This has benefitted consumers now. Condoms have never been better for both genders, but especially female condoms have been improved a lot.
Fun Facts about condoms
- Did you know that Norway sends free condoms to its citizens? You just have to order them here: https://www.gratiskondomer.no/bestill/. OBS. unfortunately, you have to be a Norwegian citizen to get them to send it.
- The largest condom in the world is myONE size G31. It’s 24 centimeters long but can stretch to the size of a pringle can. So if you’re having a large penis. This is the one for you.
Methodology
We produce an in-depth analysis of romantics and love. This topic is something that our research group is full-time on. We do everything from gathering data (using surveys), analyzing it, and writing reports. We double-check our findings with other external sources (that are listed below). We do this as one step of our fact-check process. To see if our findings differ a lot from others.
We encourage people to use our reports as sources. Since all our statistics are 100% valid. You can trust them and use them for free. The only thing we expect is that you insert a link to this site or the front page, as a source reference.
If you have any questions about the above findings or wanna hear more about the methodology feel free to write to: researchcenter@bedbible.com
