![Divorce Industry [Facts, Figures & Numbers]](https://wp.bedbible.com/wp-content/uploads/2023/08/Divorce-Industry-Facts-Figures-Numbers.png)
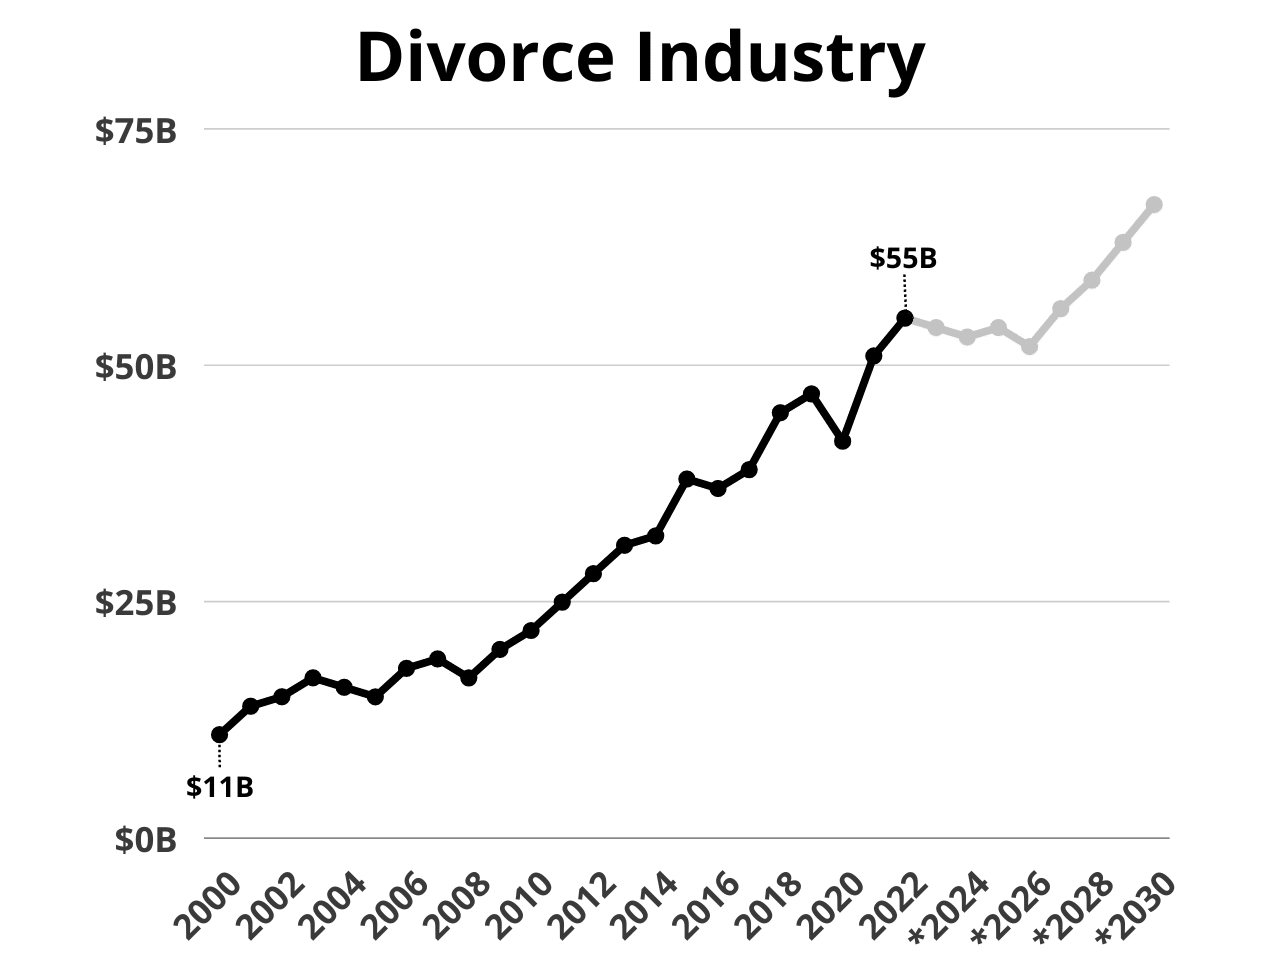
Welcome to a comprehensive exploration into the vast and complex world of the divorce industry, brought to you by the Bedbible Research Center. Our study unveils the industry’s true size, now a staggering $55 billion market, and its profound impact on society.
We’ve meticulously analyzed data from various national and international databases, cross-referencing our findings with peer-reviewed research papers to ensure utmost accuracy. This study is more than just statistics; it’s a deep dive into the real cost of divorce, its trends, and its future.
Join us as we unravel the story behind the numbers in this authoritative and exciting journey into the divorce industry. Let’s discover together.
Table of contents:
Key Statistics
- The divorce industry is worth $55 billion.
- The average divorce cost $43,941.
- The market size for the divorce law market is growing +8% YoY.
- The average hourly rate for divorce lawyers in the United States is $270 per hour.
- The divorce industry has grown x5 in the past 20 years.
- The number of divorces has stayed roughly the same in the past 20 years.
- 67% hire lawyers for their divorce.
- There is a new divorce every 36 seconds.
- A divorce with children is on average 30-40% more expensive than one without.
- The average cost per divorce has increased by almost $30,000+ in the past +22 years.
- Legal services for divorces make up 6.1% of the total $901.8 billion market size for legal services.
The Size of The Divorce Industry in the US
The total divorce industry involves not only attorneys and legal fees paid for filing a divorce. During litigation, negotiation, and trial a lot of different professions are used such as mental health professionals, accountants, and other expert witnesses.
Comparatively, Americans spend more money on suing ex-partners than they do on books, dairy cows and milk, bread and bakery products, building aircraft engines and parts, veterinary care, heavy trucks, or drilling oil and gas wells:
- Americans spent $39 billion on books
- Americans spent $38 billion on dairy cows and milk
- Americans spent $36 billion on bread and other bakery products
- Americans spent $36 billion on building aircraft engines and parts
- Americans spent $30 billion on veterinary care
- Americans spent $30 billion on manufacturing heavy trucks
- Americans spent $29 billion on drilling oil and gas wells.
| Year | Industry size | Divorces & annulments | Rate per 1000 | US Capita | Cost per divorce |
|---|---|---|---|---|---|
| 2000 | $11 billion | 1,157,834 | 4.1 | 282,398,554 | $9,500 |
| 2001 | $14 billion | 1,141,882 | 4 | 285,470,493 | $12,260 |
| 2002 | $15 billion | 1,124,566 | 3.9 | 288,350,252 | $13,338 |
| 2003 | $17 billion | 1,106,217 | 3.8 | 291,109,820 | $15,367 |
| 2004 | $16 billion | 1,087,607 | 3.7 | 293,947,885 | $14,711 |
| 2005 | $15 billion | 1,068,634 | 3.6 | 296,842,670 | $14,036 |
| 2006 | $18 billion | 1,109,086 | 3.7 | 299,753,098 | $16,229 |
| 2007 | $19 billion | 1,089,876 | 3.6 | 302,743,399 | $17,433 |
| 2008 | $17 billion | 1,069,932 | 3.5 | 305,694,910 | $15,931 |
| 2009 | $20 billion | 1,079,792 | 3.5 | 308,512,035 | $18,269 |
| 2010 | $22 billion | 1,120,258 | 3.6 | 311,182,845 | $20,003 |
| 2011 | $25 billion | 1,129,956 | 3.6 | 313,876,608 | $22,205 |
| 2012 | $28 billion | 1,076,614 | 3.4 | 316,651,321 | $26,007 |
| 2013 | $31 billion | 1,053,938 | 3.3 | 319,375,166 | $29,413 |
| 2014 | $32 billion | 1,030,509 | 3.2 | 322,033,964 | $31,052 |
| 2015 | $38 billion | 1,006,284 | 3.1 | 324,607,776 | $37,762 |
| 2016 | $37 billion | 981,631 | 3 | 327,210,198 | $37,692 |
| 2017 | $39 billion | 956,395 | 2.9 | 329,791,231 | $40,778 |
| 2018 | $45 billion | 963,206 | 2.9 | 332,140,037 | $46,718 |
| 2019 | $47 billion | 1,069,823 | 3.2 | 334,319,671 | $43,932 |
| 2020 | $42 billion | 1,142,203 | 3.4 | 335,942,003 | $36,771 |
| 2021 | $51 billion | 1,213,191 | 3.6 | 336,997,624 | $42,037 |
| 2022 | $55 billion | 1,251,672 | 3.7 | 338,289,857 | $43,941 |
| 2023* | $54 billion | 1,189,988 | 3.5 | 339,996,563 | $45,378 |
| 2024* | $53 billion | 1,261,387 | 3.5 | 360,396,357 | $42,017 |
| 2025* | $54 billion | 1,337,070 | 3.5 | 382,020,138 | $40,386 |
| 2026* | $52 billion | 1,430,665 | 3.5 | 408,761,548 | $36,346 |
| 2027* | $56 billion | 1,487,892 | 3.5 | 425,112,010 | $37,637 |
| 2028* | $59 billion | 1,547,408 | 3.5 | 442,116,490 | $38,128 |
| 2029* | $63 billion | 1,655,726 | 3.5 | 473,064,644 | $38,049 |
| 2030* | $67 billion | 1,755,070 | 3.5 | 501,448,523 | $38,175 |

Methodology – Definition
“Divorce industry” is a broad term. By itself, it might not provide the most accurate and common understanding of what we are specifically referring to.
To be more specific; when we talk about the divorce industry market size we are referring to the revenue generated through legal services provided to parties in or surrounding a divorce. That includes litigation, paper drafting, filing fees, and other legal services for divorcees.
The divorce industry comprises lawyers, paralegals, mediators, therapists, financial advisors, and other professionals who help individuals navigate divorce’s legal, emotional, and economic complexities. These professionals charge fees for their services, and the cost of divorce can quickly add up, depending on the complexity of the case.
If you’re interested in more divorce statistics then take a look at our complete marriage and divorce research here.
