

![Gift Industry Statistics [All You Need To Know]](https://wp.bedbible.com/wp-content/uploads/2024/06/Gift-Industry-Statistics.png)
Unsure of the gift industry’s landscape? This report provides a comprehensive overview with the key statistics you need. We delve into the overall market size and then explore the breakdown between private and corporate gifting.
Dig deeper into specific segments like booming gift cards, the rising trend of personalization, and even the wrapping paper industry. Finally, we’ll explore how gift-giving trends fluctuate around holidays and special events.
With this data, you’ll gain valuable insights, whether you’re a business owner, marketer, or simply curious about the world of gifting.
Table of contents:
- Market Size
- Private vs. Corporate Gifting Industry
- Gift Card Industry
- Personalized Gifting Industry
- Gift Wrapping Paper Industry Statistics
- Special Events and Holiday Gift Industry
Key Findings
- The private gifting industry is worth over $1 trillion globally (expected to grow to $1.7 trillion by 2030).
- The total US gifting industry is worth $594 billion ($365 billion in private consumer sales, and $242 billion through corporate schemes).
- The US gifting industry is expected to grow to $812 billion by 2030 (+4% CAGR)
- The average US consumer spends $1,334 on gifts each year.
- The global gift card industry is worth $869 billion (expected to grow to $1.5 trillion by 2030).
- The US gift card industry is worth $241 billion.
- The average consumer purchases 3.3 gift cards annually (with an average worth of $51.5).
- Gifting flowers is very popular, with $8.4 billion worth of flower gifts sold each year in the US (42% of the $17 billion flower market).
- Each year $20 million worth of wrapping papers is sold (an estimated 2.3 million pounds ends up in landfills).
- The average buyer spends $832 on Christmas, $175 on Valentine’s Day, $245 on Mother’s Day, $172 on Father’s Day, and $180 on Easter gifts.
Market Size
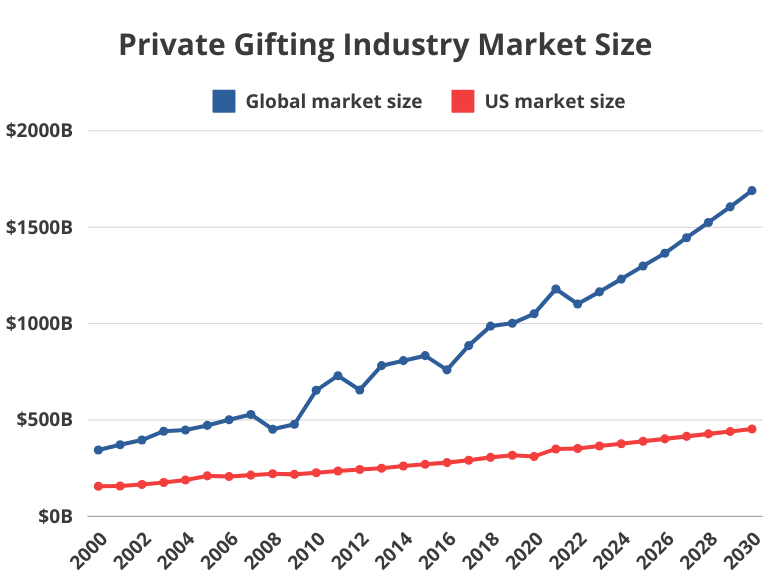
- The US private consumer gifting industry is worth $365B in 2023.
- The US private consumer on average spends $1,334 annually on gifts.
- The global private consumer gifting industry will be worth $1,165B in 2023.
- The global gifting market for private consumers is expected to grow to $1,690B by 2030.
- The US gifting market for private consumers is expected to grow to $453B by 2030.
| Year | Global private consumer gifting market | | | US private consumer gifting market | Total consumer spending (US) | Per consumer (US) |
|---|---|---|---|---|---|
| 2000 | $344B | | | $156B | $6,767B | $872 |
| 2001 | $372B | | | $158B | $7,073B | $883 |
| 2002 | $396B | | | $165B | $7,348B | $894 |
| 2003 | $442B | | | $176B | $7,740B | $905 |
| 2004 | $448B | | | $189B | $8,232B | $916 |
| 2005 | $472B | | | $210B | $8,769B | $927 |
| 2006 | $501B | | | $207B | $9,277B | $938 |
| 2007 | $529B | | | $214B | $9,747B | $949 |
| 2008 | $452B | | | $221B | $10,050B | $860 |
| 2009 | $478B | | | $218B | $9,891B | $871 |
| 2010 | $654B | | | $226B | $10,260B | $982 |
| 2011 | $730B | | | $235B | $10,699B | $993 |
| 2012 | $656B | | | $243B | $11,047B | $984 |
| 2013 | $782B | | | $250B | $11,364B | $1015 |
| 2014 | $808B | | | $261B | $11,848B | $1126 |
| 2015 | $834B | | | $270B | $12,263B | $1037 |
| 2016 | $760B | | | $279B | $12,693B | $948 |
| 2017 | $886B | | | $291B | $13,234B | $1,059 |
| 2018 | $987B | | | $306B | $13,905B | $1,170 |
| 2019 | $1,002B | | | $317B | $14,393B | $1,181 |
| 2020 | $1,051B | | | $311B | $14,116B | $1,192 |
| 2021 | $1,180B | | | $350B | $15,903B | $1,222 |
| 2022 | $1,102B | | | $352B | $16,008B | $1,334 |
| 2023 | $1,165B | | | $365B | $16,580B | $1,346 |
| 2024 | $1,231B | | | $377B | $17,151B | $1,258 |
| 2025 | $1,299B | | | $390B | $17,723B | $1,370 |
| 2026 | $1,365B | | | $402B | $18,295B | $1,382 |
| 2027 | $1,446B | | | $415B | $18,866B | $1,394 |
| 2028 | $1,525B | | | $428B | $19,438B | $1,406 |
| 2029 | $1,606B | | | $440B | $20,010B | $1,418 |
| 2030 | $1,690B | | | $453B | $20,581B | $1,430 |
Private vs. Corporate Gifting Industry
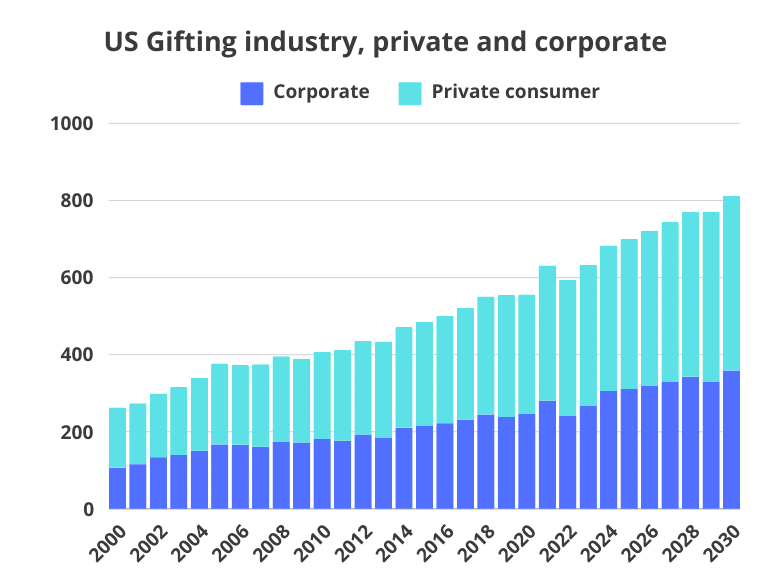
A large part of the gifting industry is corporate gifting. This market is huge, and a large part of the overall gifting industry.
- 41% of all gifts bought in the US are bought through corporations as part of a corporate gifting scheme.
- 59% of all gifts bought in the US are by private consumers for birthdays, anniversaries, and holidays.
- The US corporate gifting industry is worth $242 billion.
- The US gifting industry is worth $594 billion.
- The US corporate gifting industry on average grows +4.02% YoY (CAGR), faster than the private gifting industry (+3.84%).
- The US corporate gifting industry ($242 billion) is smaller by two-thirds than the private gifting industry ($352 billion)
| Year | Total US gifting industry | Corporate gifting industry (US) | Private consumer gifting industry (US) |
|---|---|---|---|
| 2000 | $263B | $107B | $156B |
| 2001 | $275B | $116B | $158B |
| 2002 | $299B | $134B | $165B |
| 2003 | $316B | $140B | $176B |
| 2004 | $340B | $151B | $189B |
| 2005 | $377B | $167B | $210B |
| 2006 | $373B | $166B | $207B |
| 2007 | $376B | $161B | $214B |
| 2008 | $396B | $175B | $221B |
| 2009 | $390B | $172B | $218B |
| 2010 | $407B | $181B | $226B |
| 2011 | $412B | $177B | $235B |
| 2012 | $436B | $193B | $243B |
| 2013 | $434B | $184B | $250B |
| 2014 | $472B | $211B | $261B |
| 2015 | $485B | $215B | $270B |
| 2016 | $501B | $222B | $279B |
| 2017 | $522B | $231B | $291B |
| 2018 | $551B | $245B | $306B |
| 2019 | $555B | $238B | $317B |
| 2020 | $556B | $246B | $310B |
| 2021 | $630B | $281B | $350B |
| 2022 | $594B | $242B | $352B |
| 2023 | $633B | $268B | $365B |
| 2024 | $683B | $306B | $377B |
| 2025 | $701B | $311B | $390B |
| 2026 | $722B | $320B | $402B |
| 2027 | $744B | $329B | $415B |
| 2028 | $771B | $343B | $428B |
| 2029 | $771B | $331B | $440B |
| 2030 | $812B | $359B | $453B |
Gift Card Industry
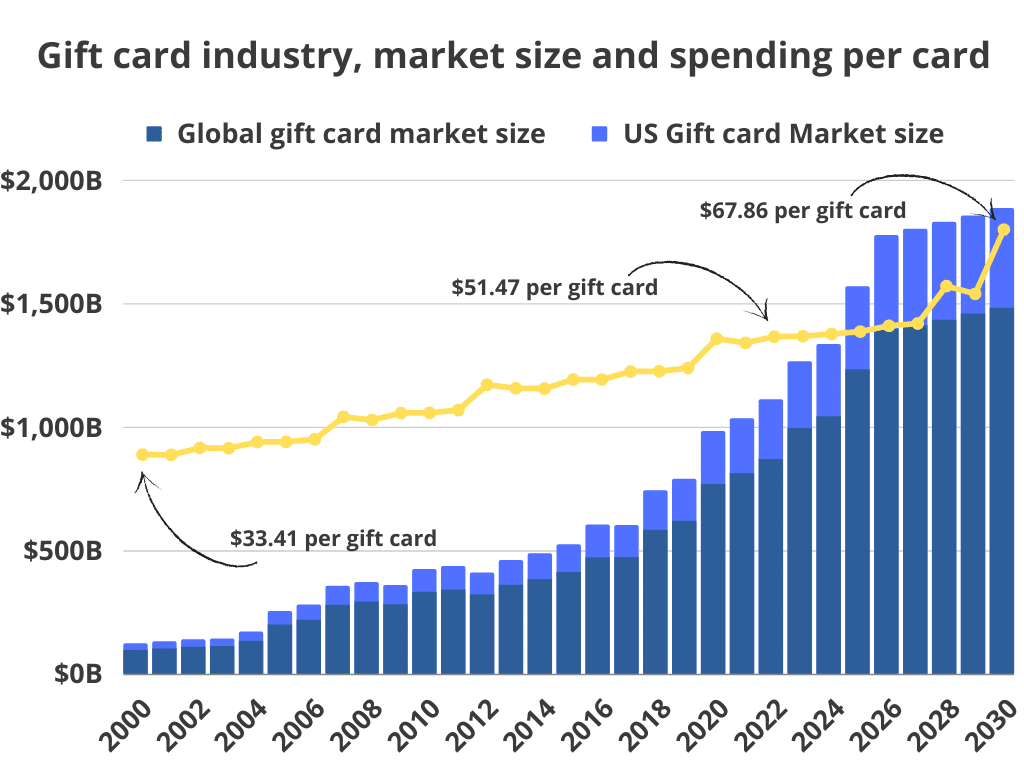
- The gift card industry is worth $869 billion globally.
- The US gift card industry is worth $241 billion.
- The average US consumer spends $51.47 per gift card.
- The average US consumer purchases 3.2 gift cards each year.
- The gift card industry is expected to grow to over $400 billion by 2030.
- The average annual growth of the gift card industry is +11% YoY (CAGR).
- The average number of gift card purchases per person has almost tripled from 1.1 in 2000 to 3.2 today.
- Spending per gift card has increased from $33.41 per gift card in 2000 to $51.47 today (a +54% increase).
| Year | Global gift card market size | US Gift card Market size | Spend per gift card (US) | Number of gift cards per consumer (US) |
|---|---|---|---|---|
| 2000 | $95B | $26B | $33.41 | 1.1 |
| 2001 | $101B | $28B | $33.38 | 1.2 |
| 2002 | $108B | $30B | $34.44 | 1.1 |
| 2003 | $111B | $30B | $34.4 | 1.3 |
| 2004 | $132B | $37B | $35.34 | 1.4 |
| 2005 | $198B | $54B | $35.37 | 1.2 |
| 2006 | $217B | $61B | $35.76 | 1.3 |
| 2007 | $278B | $76B | $39.19 | 1.5 |
| 2008 | $291B | $79B | $38.71 | 1.4 |
| 2009 | $280B | $78B | $39.78 | 1.1 |
| 2010 | $331B | $91B | $39.81 | 1.6 |
| 2011 | $340B | $95B | $40.24 | 1.8 |
| 2012 | $321B | $87B | $44.11 | 2.2 |
| 2013 | $359B | $100B | $43.57 | 2.1 |
| 2014 | $382B | $104B | $43.52 | 2.2 |
| 2015 | $411B | $112B | $44.9 | 2.2 |
| 2016 | $471B | $132B | $44.9 | 2.7 |
| 2017 | $472B | $129B | $46.13 | 3.1 |
| 2018 | $582B | $160B | $46.17 | 2.9 |
| 2019 | $619B | $169B | $46.67 | 3.2 |
| 2020 | $767B | $215B | $51.15 | 3.1 |
| 2021 | $812B | $221B | $50.53 | 3.4 |
| 2022 | $869B | $241B | $51.47 | 3.2 |
| 2023 | $994B | $271B | $51.53 | 3.3 |
| 2024 | $1042B | $292B | $51.88 | 3.4 |
| 2025 | $1233B | $336B | $52.24 | 3.5 |
| 2026 | $1396B | $380B | $53.13 | 3.4 |
| 2027 | $1411B | $391B | $53.49 | 3.6 |
| 2028 | $1433B | $397B | $59.21 | 3.7 |
| 2029 | $1459B | $396B | $58.03 | 4.1 |
| 2030 | $1482B | $404B | $67.86 | 3.8 |
Personalized Gifting Industry
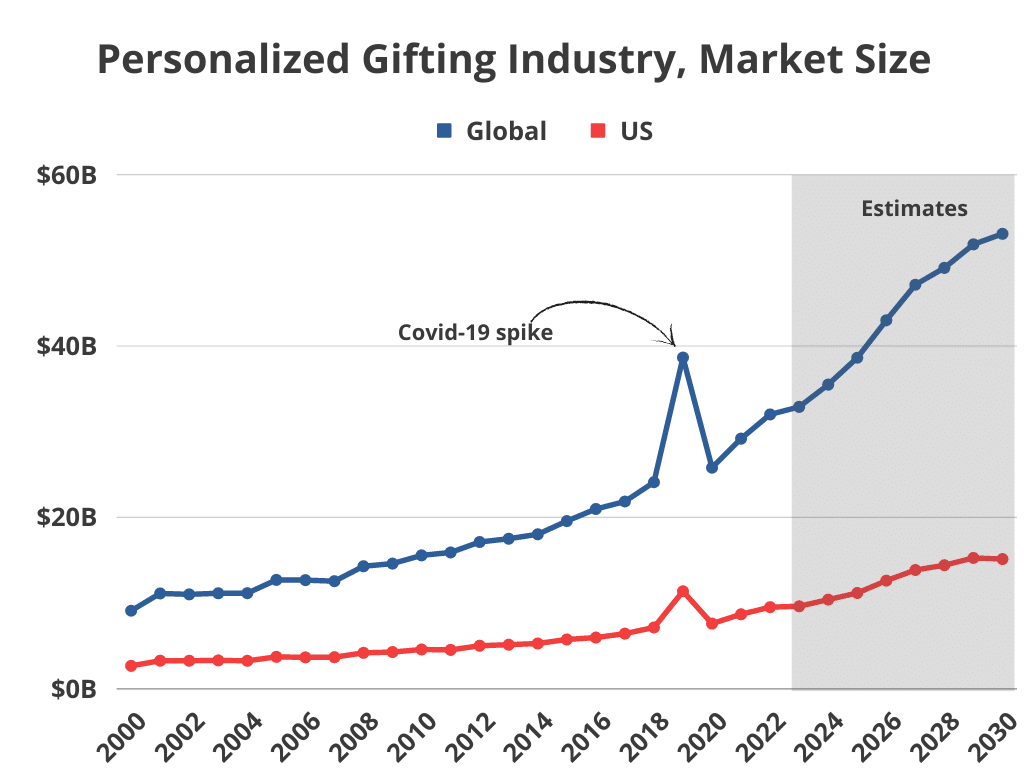
- The global personalized gifting industry is worth $32.01B.
- The US personalized gifting industry is worth $9.53B.
- The average annual growth in the personalized gifting industry is +7% (CAGR).
- The personalized gifting industry makes up 1.6% of the total US gifting industry and 2.7% of the private gifting industry.
- The personalized gifting industry is growing at almost twice the speed of the overall gifting industry.
- Personalized gifting is expected to reach sales of $53.08 billion globally by 2030
- In the US the personalized gifting industry is expected to reach $15.14 by 2030.
| Years | Global Personalized Gift Market Size | US Personalized Gift Market Size |
|---|---|---|
| 2000 | $9.11B | $2.68B |
| 2001 | $11.13B | $3.28B |
| 2002 | $11.02B | $3.28B |
| 2003 | $11.15B | $3.32B |
| 2004 | $11.16B | $3.27B |
| 2005 | $12.71B | $3.73B |
| 2006 | $12.68B | $3.67B |
| 2007 | $12.56B | $3.69B |
| 2008 | $14.30B | $4.20B |
| 2009 | $14.61B | $4.29B |
| 2010 | $15.57B | $4.59B |
| 2011 | $15.91B | $4.54B |
| 2012 | $17.13B | $5.03B |
| 2013 | $17.51B | $5.15B |
| 2014 | $18.03B | $5.29B |
| 2015 | $19.57B | $5.76B |
| 2016 | $20.98B | $5.98B |
| 2017 | $21.85B | $6.44B |
| 2018 | $24.11B | $7.16B |
| 2019 | $38.66B | $11.39B |
| 2020 | $25.8B | $7.61B |
| 2021 | $29.19B | $8.70B |
| 2022 | $32.01B | $9.53B |
| 2023 | $32.89B | $9.63B |
| 2024 | $35.49B | $10.41B |
| 2025 | $38.62B | $11.18B |
| 2026 | $42.99B | $12.62B |
| 2027 | $47.14B | $13.86B |
| 2028 | $49.11B | $14.42B |
| 2029 | $51.85B | $15.27B |
| 2030 | $53.08B | $15.14B |
Gift Wrapping Paper Industry Statistics
Wrapping paper is a large part of the total US $594 billion gifting industry (0.003% of the total industry).
- $20.33 million worth of wrapping paper is sold and used each year in the US.
- 2.31 million pounds of wrapping paper are sold and used each year in the US.
| Years | Wrapping Paper Market Size | Pounds of Wrapping Paper Sold |
|---|---|---|
| 2000 | $7.9M | 0.81M pounds |
| 2001 | $7.54M | 0.71M pounds |
| 2002 | $8.19M | 0.92M pounds |
| 2003 | $8.83M | 1.11M pounds |
| 2004 | $9.47M | 0.97M pounds |
| 2005 | $9.11M | 1.01M pounds |
| 2006 | $6.76M | 0.76M pounds |
| 2007 | $9.6M | 1.08M pounds |
| 2008 | $7.96M | 0.88M pounds |
| 2009 | $9.31M | 1.05M pounds |
| 2010 | $8.67M | 0.97M pounds |
| 2011 | $9.03M | 1.01M pounds |
| 2012 | $11.39M | 1.29M pounds |
| 2013 | $12.74M | 1.44M pounds |
| 2014 | $10.1M | 1.14M pounds |
| 2015 | $11.46M | 1.29M pounds |
| 2016 | $12.81M | 1.45M pounds |
| 2017 | $14.17M | 1.6M pounds |
| 2018 | $15.11M | 1.71M pounds |
| 2019 | $17.22M | 1.94M pounds |
| 2020 | $18.82M | 2.12M pounds |
| 2021 | $19.1M | 2.16M pounds |
| 2022 | $20.33M | 2.31M pounds |
| 2023 | $21.9M | 2.06M pounds |
| 2024 | $23.21M | 2.62M pounds |
| 2025 | $24.91M | 3.12M pounds |
| 2026 | $25.74M | 2.64M pounds |
| 2027 | $26.11M | 2.89M pounds |
| 2028 | $27.82M | 3.14M pounds |
| 2029 | $28.93M | 3.26M pounds |
| 2030 | $30.01M | 3.32M pounds |
Special Events and Holiday Gift Industry
In the following sections, we reveal all the findings from the dataset on gift purchasing around holidays and special events.
When asking people, what occasions warrant a gift they answer the following:
- 88% believe that birthdays warrant gifts.
- 80% believe that weddings warrant a gift.
- 80% believe that holidays such as Christmas warrant gifts.
- 63% believe that anniversaries warrant a gift.
- 60% believe that High School Graduations warrant gifts.
- 60% believe that Valentine’s Day warrants a gift.
Christmas Gifting Statistics
- On average people spend $832 on Christmas gifts and decorations.
- US retail sales increased by +14% In November and December (2022) from the previous year (2021).
When people report, what they want to spend, they answer:
- 31% report to want to spend between $100-300 on Christmas gifts.
- 29% report to want to spend less than $100 on Christmas gifts.
- 33% report to want to spend between $300-1000 on Christmas gifts.
- 7% report to want to spend more than $1000 on Christmas gifts.
Unsurprisingly, the holiday shopping often comes a little late for some, while others are weeks in advance.
- 32% report to have bought all presents before the 18th of December.
- 1% buy all their Christmas presents on the 25th of December.
- 61% of customers report to start buying Christmas presents in November.
When asked, how respondents found out what to buy, we saw that:
- 46% of respondents reported that social media played a role in what gifts they bought.
- 38% reported looking at and finding inspiration in in-store displays.
- 36% used the retailer’s websites to decide on what gifts to purchase.
- 28% picked up holiday flyers and catalogs to choose gifts to buy.
- 28% decided on gifts based on the best sales during Black Friday.
- 17% used to print or web guides on e.g. “the best gifts” to decide on what to buy for Christmas.
Valentine’s Day Gift Industry Statistics
- On average, people who buy Valentine’s Day Gifts plan to spend $175
- The most popular gifts for Valentine’s Day are Candy (56% gift it), greeting cards (40%), flowers (37%), experiences (31%), and jewelry (22%).
The total spending for Valentine’s Day is tremendous:
- Valentine’s Day Spending has reached $26 billion in the US.
If we look at what that $26 billion was spent on, we find that
- 1.6 billion is spent on gifting Valentine’s Day candy.
- 9.6 billion is spent on gifting Valentine’s Day flowers.
- 8.1 billion is spent on gifting experiences on Valentine’s Day.
- 5.2 billion is spent on gifting jewelry for Valentine’s Day.
Mother’s Day Gifting Industry Statistics
- Mother’s Day spending is expected to reach $32 billion – an increase of 14% from the last Mother’s Day.
- 84% of people report that they celebrate Mother’s Day.
- The average person spends $245 on Mother’s Day.
- Over 80% of mothers report that they would prefer experiences as gifts.
- 39% of gift givers are considering giving subscriptions for Mother’s Day.
- 90% of consumers anticipate that they will buy a gift for Mother’s Day.
- 41% of consumers have joined a loyalty program for Mother’s Day.
- 74% of shoppers buy the Mother’s Day present within a month of the date (May 14).
- The most popular Mother’s Day gift is flowers (53% buy flowers), followed by greeting cards (38%), and jewelry (28%). , clothing and accessories (23%), and experiences (22%).
- So, while 80% of mothers prefer experiences as gifts, it is the least popular gift type purchase on Mother’s Day.
- 68% shop for their actual mother, while 28% shop for their mother-in-law, 14% for their sister, 12% for their daughter, and 11% for their grandmother.
- Only 15% of consumers say that they consider finding an affordable present the top priority.
- 1 in 3 mothers wish for a ‘day off’ as mothers for Mother’s Day.
Father’s Day Gifting Industry Statistics
- Over $20 billion is spent on Father’s Day gifting.
- Consumers plan to spend $172 for Father’s Day.
- 77% of men plan to celebrate Father’s Day, while only 75% of women plan to do the same (in comparison, 80% plan to celebrate Mother’s Day).
- 72 million greeting cards are sold each year for Father’s Day.
- 1 in 4 gifted Father’s Day cards has humor in them (typically dad jokes).
- 91% of fathers prefer experiences as gifts for Father’s Day.
- Neckties is the #1 most popular Father’s Day gift.
- Father�’s Day was signed into law in 1972 and became an official national holiday.
Easter Gifting Statistics
- More than $21 billion is spent annually on Easter celebrations and gifts.
- The average consumer spends $180 on Easter gifts and celebrations, more than on Valentine’s Day ($175), and Father’s Day ($174).
- 80% of consumers celebrate Easter.
- 16% plan on opening gifts together for Easter.
- 90% buy some type of candy for Easter.
- 64% buy toys as a gift for Easter.
- 37% buy Easter Eggs as gifts for the Holiday.
| Year | Per person expected Easter spending |
|---|---|
| 2009 | $116.59 |
| 2010 | $118.60 |
| 2011 | $131.04 |
| 2012 | $145.28 |
| 2013 | $145.13 |
| 2014 | $137.46 |
| 2015 | $140.62 |
| 2016 | $146.00 |
| 2017 | $151.91 |
| 2018 | $150.05 |
| 2019 | $151.25 |
| 2020 | $175.85 |
| 2021 | $179.70 |
| 2022 | $169.79 |
| 2023 | $162.42 |