


Trust, commitment, and fidelity form the bedrock of romantic relationships. Yet, infidelity remains a pervasive challenge, with its implications echoing across time, cultures, and personal experiences.
This comprehensive study not only charts the historical trends of reported infidelity but also delves into the nuances of what different cultures and genders perceive as cheating. From the sharp rise in reported cheating over the decades to the intricate dynamics of post-infidelity, this report paints a vivid picture of the complexities of human relationships.
Whether you’re curious about the countries with the highest cheating rates or the aftermath of admitting infidelity, this statistical exploration provides a thought-provoking journey into the world of romantic betrayals.
Contents:
- Have you cheated on any partner?
- Have you cheated on your current partner?
- Why do people cheat?
- Economic Affair
- Infidelity demographics
- How common is admitting to cheating?
- How long do affairs last?
- What happened when the partner found out?
- How do couples handle infidelity?
- Which country cheats the most?
- What do you consider cheating? (EU vs USA)
- How did you meet the person you cheated with?
Key Findings
- 23% of people have cheated on a partner (it was 5% in the year 1960).
- 14% of people have cheated on their current partner (it was 6% in year 1960).
- 21% of men have cheated on their current partner compared to 7% of women who have cheated on their current partner.
- 40% of unmarried couples experience one of their partner’s cheats.
- 7 out of 10 men and 6 out of 10 women will cheat if it’s guaranteed they’ll not get caught.
- 3% of the 18 and 19-year-olds have cheated on a partner
- 58 years old is the age at most cheats (20%)
- 49.8% of people do not admit to cheating.
- 60% of affairs start with a close friend or co-worker.
- Only 12.6% meet their affair in a bar/club.
- 9.4% meet their affair on Social Media.
- 17% got caught by their partner.
- The average affair lasts 1 year and 10 months.
- 47.7% of the unfaithful was discovered in less than 1 week (25.7% took more than 6 months)
- 54.5% broke up immediately after they were discovered (15.6% are still together)
- The top 5 countries with the highest infidelity rates are:
Thailand (51%)
Denmark (46%)
Germany (45%)
Italy (45%)
France (43%) - The 5 countries with the lowest infidelity rates are:
Vatican City (3%)
Uruguay (10%)
Slovenia (11%)
Saint Kitts and Nevis (12%)
Trinidad and Tobago (13%)
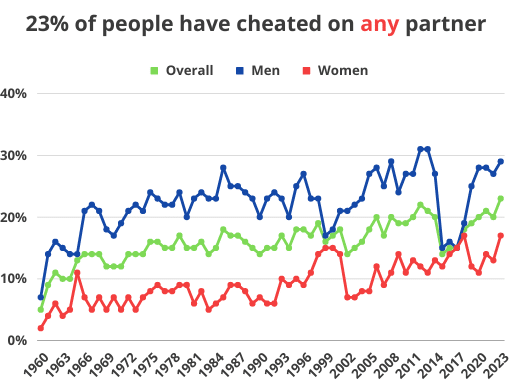
Have you cheated on any partner?
- Overall Trend: The percentage of people who reported having cheated on a partner has generally increased over the years. In 1960, only 5% reported cheating, while in 2023, this number has risen to 23%.
- Gender Differences:
- Men: The percentage of men who reported cheating started at 7% in 1960 and reached its peak at 31% in both 2012 and 2013. By 2023, this number is 29%.
- Women: The percentage of women who reported cheating was significantly lower in the early years, starting at 2% in 1960. However, by 2023, this number will have increased to 17%.
- Highest Reports:
- Overall: The highest percentage of people reporting cheating was in 2023, with 23%.
- Men: The highest percentage for men was 31% in both 2012 and 2013.
- Women: The highest percentage for women was 17% in 2023.
- Notable Years:
- 1999: This year stands out as the gap between men and women who reported cheating was the smallest, with men at 17% and women at 15%.
- 2017: This is the first year where the percentage of women who reported cheating matched that of men, both at 15%.
- Recent Years: In the last decade (from 2013 to 2023), the percentage of overall cheating has fluctuated between 14% to 23%. The gap between men and women has also narrowed, with women’s percentages rising closer to men’s.
- Decade Averages (approximate):
- 1960s: Overall cheating was around 11%.
- 1970s: Overall cheating was around 15%.
- 1980s: Overall cheating was around 16%.
- 1990s: Overall cheating was around 17%.
- 2000s: Overall cheating was around 18%.
- 2010s: Overall cheating was around 19%.
- The 2020s (up to 2023): Overall cheating has been around 20%.
Get access to the dataset here: https://docs.google.com/spreadsheets/d/1x7qhOqXKLB5_9NC_BrBe0eD0Qv76S9L4BUKUJsouvXI/edit?usp=sharing
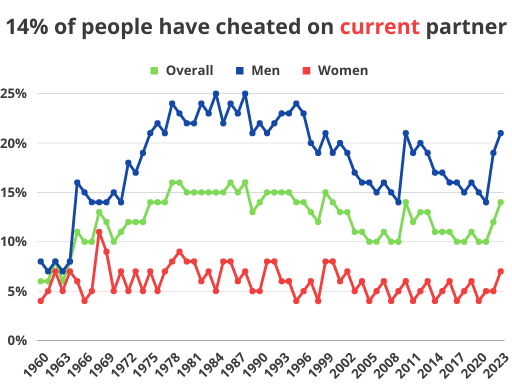
Have you cheated on your current partner?
- Overall Trend: The percentage of people who reported cheating on their current partner has seen fluctuations over the years. It started at 6% in 1960 and reached 14% in 2023.
- Gender Differences:
- Men: The percentage for men started at 8% in 1960 and peaked at 25% in 1984. By 2023, it stands at 21%.
- Women: The percentage of women started at 4% in 1960 and peaked at 11% in 1968. By 2023, it is 7%.
- Highest Reports:
- Overall: The highest percentage of overall cheating on a current partner was 16% in both 1978 and 1979.
- Men: The highest percentage for men was 25% in 1984.
- Women: The highest percentage for women was 11% in 1968.
- Notable Years:
- 1968: This year stands out as the gap between men and women was the smallest, with men at 14% and women at 11%.
- 2010: This year saw a significant jump in the percentage of men who reported cheating, going from 14% in 2009 to 21% in 2010.
- Recent Years: In the last decade (from 2013 to 2023), the percentage of overall cheating on a current partner has ranged from 10% to 14%. The gap between men and women has remained relatively stable.
- Decade Averages (approximate):
- 1960s: Overall cheating was around 9%.
- 1970s: Overall cheating was around 13%.
- 1980s: Overall cheating was around 15%.
- 1990s: Overall cheating was around 14%.
- 2000s: Overall cheating was around 12%.
- 2010s: Overall cheating was around 12%.
- 2020s (up to 2023): Overall cheating has been around 11%.
- Stable Periods: The data shows periods of relative stability, such as the late 1980s and the early 2000s, where the percentages did not vary much from year to year.
These statistics offer insights into the dynamics of fidelity within current relationships over the years. While the percentages have fluctuated, there has been a general increase in recent years, especially among men.
Get access to the dataset here: https://docs.google.com/spreadsheets/d/1MfFWYrmiZHXSXIkkMIY14FHLMbSAaUPnMXBtQlw4K6E/edit?usp=sharing
Why do people cheat?
Infidelity is a complex issue, and while many assume that dissatisfaction in a relationship is the primary cause, the reasons people cheat are multifaceted and not always rooted in unhappiness. Here’s a deeper look into the motivations behind cheating, supported by statistics. This is the top 5 reasons:
Women:
1. Want more attention from the partner
2. The affair was there for me
3. I was confused about my partner
4. The other person was attractive
5. I was bored in the old relationship
Men:
1. The other person was attractive
2. The other person talked me into it
3. I was confused about my partner
4. Bad or no sex with the partner
5. Want more attention from the partner
Economic Affair
A growing trend, financial cheating involves partners hiding money or debts from each other. About 40% of individuals in serious relationships have kept financial secrets from their partners, with 51% of Millennials admitting to such behavior.
- What Constitutes Financial Infidelity?
- Hidden Purchases: Buying items without informing a partner, especially when those purchases are outside the agreed-upon budget or are luxury items.
- Secret Accounts: Opening and maintaining bank accounts or credit cards without a partner’s knowledge.
- Hidden Debts: Accumulating debts—whether from credit cards, loans, or other sources—and not disclosing them.
- Concealed Assets: Not revealing certain assets, such as investments, property, or cash reserves.
- Lying About Income: Misrepresenting one’s earnings, either by inflating or deflating the actual amount.
- Why Do People Commit to Financial Infidelity?
- Fear of Judgment: Some individuals fear their partner’s reaction to certain financial decisions or mistakes.
- Desire for Autonomy: A need for financial independence or a sense of control can drive some to keep secrets.
- Avoiding Conflict: To sidestep potential arguments or confrontations about money.
- Personal Vices: Some may hide financial details to cover up spending on habits like gambling, shopping sprees, or substance abuse.
- The Impact on Relationships:
- Eroded Trust: Just as with other forms of infidelity, financial deceit can severely damage trust.
- Increased Financial Strain: Hidden debts or mismanaged funds can lead to unexpected financial pressures.
- Emotional Distress: Discovering financial infidelity can lead to feelings of betrayal, confusion, and insecurity.
- Statistics on Financial Infidelity:
- 19% of U.S. adults in live-in relationships have hidden a bank account or credit card from their partner.
- 2 in 5 Americans admit to lying about or hiding financial details from a partner.
- Millennials, in particular, seem more prone to this behavior, with 51% admitting to committing financial infidelity.
- Addressing the Issue:
- Open Communication: Regular financial check-ins and discussions can prevent misunderstandings and promote transparency.
- Joint Financial Goals: Setting shared financial objectives can align priorities and foster collaboration.
- Seeking Counseling: Financial therapists or counselors can guide navigating financial disagreements and rebuilding trust.
In essence, financial infidelity, like other forms of betrayal, can have profound effects on a relationship. However, with awareness, open communication, and a commitment to rebuilding trust, couples can overcome the challenges posed by financial deceit
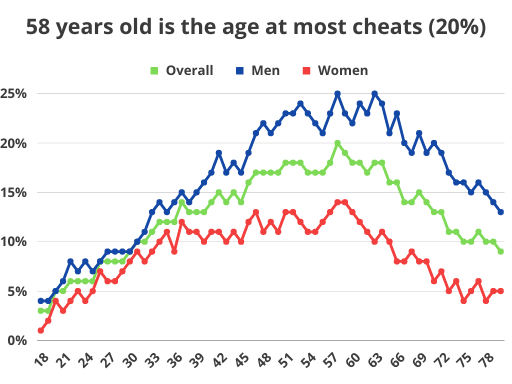
Infidelity Demographics (age and gender)
As already indicated in the first two data tables displayed above we have included demographic data on things such as age and gender. The tabulated data can be found in the below table (2021 data). It was not possible to collect data on respondents over 80 years old without making data collection unreasonably expensive.
- Overall Trend by Age: Infidelity rates start low in the late teens (3% for ages 18 and 19) and gradually increase, peaking in the late 50s (20% at age 58) before declining again in the older age groups.
- Gender Differences:
- Men: Infidelity rates for men start at 4% at age 18 and peak at 25% at both ages 58 and 63. The rate then declines to 13% by age 80.
- Women: Infidelity rates for women start at 1% at age 18, peak at 14% at ages 58 and 59, and then decline to 5% by age 80.
- Age Groups with Highest Infidelity Rates:
- Overall: The age group with the highest reported infidelity is 58 years old at 20%.
- Men: Men aged 58 and 63 have the highest infidelity rate at 25%.
- Women: Women aged 58 and 59 have the highest infidelity rate at 14%.
- Age Groups with Lowest Infidelity Rates:
- Overall: The age group with the lowest reported infidelity is 18 years old at 3%.
- Men: Men aged 18 and 19 have the lowest infidelity rate at 4%.
- Women: Women aged 18 have the lowest infidelity rate at 1%.
- Notable Observations:
- Age 26: This is the first age where the infidelity rate for women reaches 7%, which is close to the rate for men (8%).
- Age 30: The infidelity rate for women is 8%, which is only 1% less than that of men.
- Age 31-32: The infidelity rates for both genders are very close, with only a 1% difference.
- Age 35-36: The gap between men and women widens again, with men at 13-14% and women at 9-11%.
- Late 50s to Early 60s: This age range sees the highest infidelity rates for both genders.
- Elderly Trend: After peaking in the late 50s, infidelity rates gradually declined for both genders. By the age of 80, the rates have decreased to 9% overall, 13% for men, and 5% for women.
- General Observation: Throughout the age range, men consistently report higher infidelity rates than women. However, the gap between the genders narrows and widens at various points.
These statistics provide insights into how infidelity rates vary across different age groups and between genders. The data suggests that infidelity rates increase with age, peak in the late 50s, and then decline in the later years of life.
Get access to the dataset here: https://docs.google.com/spreadsheets/d/1EiRZzsjgpLJLcu7zXs6AwS66C4IqRFoaML6eNahE3OA/edit?usp=sharing
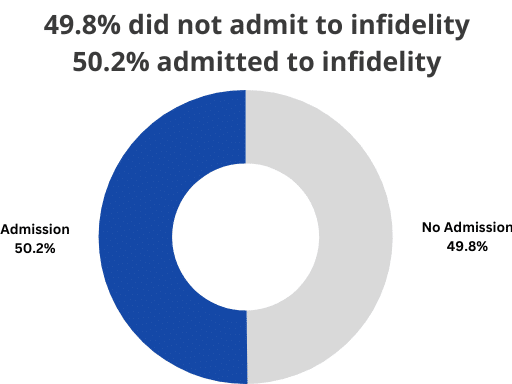
How common is admitting to cheating?
Diving into the aftermath of infidelity, one of the things that we took a look at was how common it was for the cheating to stay a secret in the relationship, or become known for the partner.
| Overall | | | Guilt | Partner had a right to know | Caught by partner | Feared STD | |
|---|---|---|---|---|---|---|
| No admission | 49.8% | | | – | – | – | – |
| Admission | 50.2% | | | 41% | 32% | 17% | 10% |
- No Admission vs. Admission:
- 49.8% of respondents did not admit to infidelity.
- 50.2% of respondents admitted to infidelity.
- Among Those Who Admitted to Infidelity:
- 41% felt guilt.
- 32% believed their partner had a right to know.
- 17% were caught by their partner.
- 10% feared contracting a sexually transmitted disease (STD).
How long do affairs last?
Additionally, we asked the group 50.2% how long time passed before the infidelity became known to their partner.
| Time | % who answered in this group |
|---|---|
| <1 week | 47.7% |
| <1 month | 26.6% |
| +6 months | 25.7% |
- 47.7% said it was discovered in less than 1 week.
- 26.6% said it took less than 1 month.
- 25.7% said it took more than 6 months.
What happened when the partner found out?
Of the respondents who admitted to cheating on a partner, 54.5% said they broke up immediately. 30% tried staying together but are broken up now, and 15.6% are still together.
| What happened? | % who answered in this group |
|---|---|
| Broke up immediately | 54.5% |
| Tried staying together, but are broken up now | 30% |
| Still together | 15.6% |
How do couples handle infidelity?
The following tabulation should not be taken as a strictly causation study or evidence. The below tabulation simply shows a statistical correlation between the response of the partner to becoming aware of cheating and the result on the relationship status. It does not mean that mimicking the responses will affect your relationship.
| Response to infidelity | Not together | Still together |
|---|---|---|
| Let their partners look through their phones | 55.7% | 45.6% |
| Avoid certain friends | 48.5% | 38.1% |
| Limitations on going out | 43.3% | 23.1% |
| Let their partner access their social media | 39.2% | 25.3% |
| End the affair | 30.9% | 20.1% |
| Withhold sex | 28.9% | 25.3% |
| Only communicate with the opposite sex with permission | 27.8% | 7.2% |
| Get tested for STDs | 23.7% | 33.2% |
| Limit alcohol intake | 19.6% | 4.9% |
- 55.7% of those who are not together and 45.6% of those still together let their partners look through their phones.
- 48.5% of those not together and 38.1% of those still together avoid certain friends.
- 43.3% of those not together and 23.1% of those still together imposed limitations on going out.
- 39.2% of those not together and 25.3% of those still together allowed their partner to access their social media.
- 30.9% of those not together and 20.1% of those still together ended the affair.
- 28.9% of those not together and 25.3% of those still together withheld sex.
- 27.8% of those not together and 7.2% still together only communicated with the opposite sex with permission.
- 23.7% of those not together and 33.2% of those still together got tested for STDs.
- 19.6% of those not together and 4.9% of those still together limited their alcohol intake.
The differences between the actions of those who stayed together and those who didn’t after cheating occurred provide insights into the dynamics of relationships post-infidelity and potential indicators of a relationship’s resilience or vulnerability:
- Transparency and Trust: The fact that a higher percentage of individuals who didn’t stay together allowed their partners to look through their phones compared to those who stayed together might suggest that while transparency is crucial, it alone might not be sufficient to rebuild trust. It could also indicate that those who broke up felt a stronger need to prove their honesty or faced more suspicion.
- Social Interactions: Those not in a relationship anymore were more likely to avoid certain friends. This could imply that external influences or peer groups played a significant role in the infidelity or the aftermath, making it harder for these couples to move past the incident.
- Limiting Activities: The higher percentage of individuals not together who limited their outings might suggest that restricting personal freedom post-infidelity can contribute to relationship strain rather than healing.
- Communication Restrictions: The stark difference in the category of communicating with the opposite sex only with permission—much higher among those who broke up—indicates that imposing stringent communication boundaries can be counterproductive. Such restrictions might exacerbate feelings of mistrust and resentment.
- Health Concerns: The fact that more of those who stayed together got tested for STDs than those who didn’t might indicate a proactive approach to addressing the practical implications of infidelity. This could reflect a commitment to starting afresh with a clean slate and ensuring the well-being of both partners.
- Limiting Alcohol: The low percentages in both groups for limiting alcohol intake suggest that while alcohol might play a role in some instances of infidelity, it’s not a primary concern for most when addressing the aftermath.
- End of Affair vs. Continuation: While ending the affair was a step taken by many, the data suggests that merely ending the affair doesn’t guarantee relationship recovery. The underlying issues leading to the affair and how the aftermath is handled play pivotal roles.
In essence, the differences between the two groups highlight that while certain actions, like seeking transparency and addressing practical concerns, are essential post-infidelity, the success of a relationship’s recovery hinges on deeper factors. These include effective communication, mutual understanding, addressing root causes, and a genuine commitment to rebuilding trust. Overly restrictive measures or actions driven by guilt or fear, rather than mutual understanding and healing, might be less effective in the long run.
Which country cheats the most?
In the following, we were able to gather data on 50 countries. Time, economic, or simply access possibilities were constraints that prevented data on more countries from being gathered.
| Rank | Country | Overall |
|---|---|---|
| #1 | Thailand | 51% |
| #2 | Denmark | 46% |
| #3 | Germany | 45% |
| #4 | Italy | 45% |
| #5 | France | 43% |
| #6 | Norway | 41% |
| #7 | Belgium | 40% |
| #8 | Spain | 39% |
| #9 | Finland | 36% |
| #10 | United Kingdom | 36% |
| #11 | Canada | 36% |
| #12 | Greece | 36% |
| #13 | Luxembourg | 36% |
| #14 | Austria | 35% |
| #15 | Brazil | 35% |
| #16 | Iceland | 35% |
| #17 | Netherlands | 35% |
| #18 | Portugal | 35% |
| #19 | Sweden | 35% |
| #20 | United States | 35% |
| #21 | Argentina | 34% |
| #22 | Australia | 34% |
| #23 | Bahamas | 34% |
| #24 | Croatia | 34% |
| #25 | Cyprus | 34% |
| #26 | Latvia | 34% |
| #27 | Liechtenstein | 34% |
| #28 | Mexico | 34% |
| #29 | Panama | 34% |
| #30 | Slovakia | 34% |
| #31 | Estonia | 33% |
| #32 | Ireland | 33% |
| #33 | Czech Republic | 31% |
| #34 | Hungary | 31% |
| #35 | New Zealand | 31% |
| #36 | Monaco | 29% |
| #37 | Costa Rica | 28% |
| #38 | Lithuania | 27% |
| #39 | Malta | 27% |
| #40 | Switzerland | 25% |
| #41 | Chile | 22% |
| #42 | Barbados | 21% |
| #43 | Antigua and Barbuda | 16% |
| #44 | Poland | 16% |
| #45 | Andorra | 15% |
| #46 | Trinidad and Tobago | 13% |
| #47 | Saint Kitts and Nevis | 12% |
| #48 | Slovenia | 11% |
| #49 | Uruguay | 10% |
| #50 | Vatican City | 3% |
Top Countries for Cheating: Thailand tops the list with 51% of respondents admitting to cheating, followed closely by Denmark (46%), Germany (45%), Italy (45%), and France (43%).
Middle Range: Countries like Spain, Belgium, Norway, and Finland have cheating rates ranging from 36% to 41%. Notably, the United Kingdom, Canada, Greece, Luxembourg, and several others are clustered around the 36% mark.
United States: The United States stands at the 20th position with a cheating rate of 35%, which is similar to several European countries like Sweden, Netherlands, and Austria.
Lower End of the Spectrum: Countries like Chile, Barbados, Poland, and Andorra have cheating rates ranging from 15% to 22%.
Least Prevalence: The countries with the lowest reported rates of cheating are Uruguay (10%), Slovenia (11%), Saint Kitts and Nevis (12%), Trinidad and Tobago (13%), and Vatican City with the lowest at 3%.
What do you consider cheating? (EU vs. USA)
To explore the subject of what infidelity and cheating mean to people we have also tabulated the data on this aspect. In this way, it is possible to find regional or country-specific differences.
Here, most notably we tabulated all European countries in our dataset against all US-based respondents. Additionally, we included gender in the tabulation and asked respondents to answer what they would consider cheating.
In summary, the US generally has a stricter view of what constitutes cheating compared to Europe across various intimate behaviors.
| US, All | US, Men | US, Women | | | Europe, All | Europe, Men | Europe, Women | |
|---|---|---|---|---|---|---|---|
| Vaginal intercourse | 98% | 97% | 99% | | | 84% | 81% | 86% |
| Oral intercourse | 98% | 97% | 98% | | | 81% | 78% | 84% |
| Anal intercourse | 96% | 95% | 98% | | | 79% | 76% | 82% |
| Kissing | 84% | 81% | 86% | | | 73% | 67% | 78% |
| Heavy petting | 81% | 75% | 86% | | | 67% | 62% | 72% |
| Spooning | 67% | 63% | 71% | | | 40% | 35% | 44% |
| Cuddling | 65% | 63% | 68% | | | 37% | 30% | 43% |
| Getting close emotionally | 62% | 53% | 71% | | | 40% | 32% | 47% |
| Sleeping in the same bed | 57% | 51% | 62% | | | 39% | 35% | 42% |
| Holding hands | 50% | 47% | 53% | | | 29% | 25% | 33% |
| Going out as friends | 37% | 29% | 44% | | | 20% | 17% | 23% |
What counts as infidelity is a matter of individual opinion as you can see through the results. Some might even be jealous of a partner who masturbates with sex toys without their partner, for example, if using a Fleshlight as they are supposed to replicate a real vagina or the use of real-life sex dolls. For some, watching porn could be considered as cheating. There has also been a discussion about remote sex toys if this does not count as cheating because there is no physical touch. It doesn’t matter if it’s remote control butt plugs.
- Vaginal, Oral, and Anal Intercourse: These acts are overwhelmingly considered cheating in both the US and Europe, with the US having slightly stricter views. For instance, 98% of US respondents view vaginal intercourse as cheating, compared to 84% in Europe.
- Kissing and Heavy Petting: These are also largely viewed as forms of cheating, especially in the US. For example, 84% of US respondents consider kissing as cheating, while the figure stands at 73% in Europe.
- Spooning and Cuddling: The perception of these acts as cheating drops significantly, especially in Europe. Only 40% of Europeans view spooning as cheating, compared to 67% in the US.
- Emotional Closeness: This is an interesting area where there’s a notable difference between the US and Europe. In the US, 62% view getting close emotionally as cheating, whereas in Europe, it’s only 40%.
- Physical Proximity: Acts like sleeping in the same bed or holding hands are less commonly viewed as cheating, but still, a significant portion of respondents in both regions consider them infidelity. For instance, 57% in the US view sleeping in the same bed as cheating, compared to 39% in Europe.
- Going Out as Friends: This is the least commonly viewed form of cheating, with only 37% in the US and 20% in Europe considering it as such.
How did you meet the person you cheated with?
The last aspect of the dataset has to do with how the cheating party met and engaged in the cheating.
We tabulated this data solely on gender for the below example:
| How did you meet? | All | | | Women | Men |
|---|---|---|---|---|
| Friend | 36.8% | | | 40.6% | 32.9% |
| Work | 31.0% | | | 33.3% | 28.6% |
| Other | 19.7% | | | 17.5% | 21.8% |
| Bar | 16.0% | | | 12.4% | 19.5% |
| Social media | 7.2% | | | 7.1% | 7.3% |
| Dating service | 9.8% | | | 4.7% | 14.9% |
| Vacation or business trip | 5.6% | | | 4.2% | 6.9% |
| School | 0.5% | | | 0.7% | 0.3% |
| Cheating-specific dating service | 1.6% | | | 0.2% | 3.0% |
- Friend: The most common way people met someone they cheated with was through friends, with 36.8% of all respondents indicating this. Women (40.6%) were more likely than men (32.9%) to cheat with a friend.
- Work: The workplace was the second most common place, with 31.0% of all respondents. Women (33.3%) slightly outnumbered men (28.6%) in this category.
- Other: 19.7% of respondents met the person they cheated with through other means. Men (21.8%) were slightly more likely than women (17.5%) to report this.
- Bar: 16.0% of all respondents met the person at a bar. Men (19.5%) were more likely than women (12.4%) to meet someone they cheated with at a bar.
- Dating Service: 9.8% of all respondents met through a dating service. Men (14.9%) were significantly more likely than women (4.7%) to use this method.
- Social Media: 7.2% of respondents met through social media, with little difference between men (7.3%) and women (7.1%).
- Vacation or Business Trip: 5.6% of respondents met the person during a vacation or business trip. Men (6.9%) were slightly more likely than women (4.2%) to report this.
- Cheating-specific Dating Service: 1.6% of all respondents used a dating service specifically for cheating. Men (3.0%) were notably more likely than women (0.2%) to use such a service.
- School: This was the least common method, with only 0.5% of all respondents indicating they met the person they cheated with at school.
In summary, friends and the workplace are the most common avenues through which individuals meet someone they end up cheating with. There are some gender differences, with men being more likely to meet someone at a bar or through a dating service, while women are more likely to cheat with a friend or colleague.
Conclusion
Infidelity remains a complex and evolving aspect of romantic relationships, with a notable increase in reported cases over the decades.
As of this year, nearly a quarter of individuals have admitted to cheating on a partner, a significant rise from the 5% reported in 1960. Men appear more likely to cheat than women and infidelity rates peak in the late fifties.
Interestingly, over half of relationships end immediately upon the revelation of an affair. Globally, countries like Thailand, Denmark, and Germany have particularly high infidelity rates, suggesting cultural nuances in perceptions and attitudes toward cheating. As society continues to evolve, understanding the underlying factors and consequences of infidelity becomes even more crucial for fostering healthy relationships.
How to get over cheating?
Infidelity can be a deeply traumatic experience, shaking the very foundation of trust in a relationship. However, healing is possible. Here are some steps to consider:
- Accept Your Feelings: It’s natural to feel a range of emotions, from anger to sadness. Allow yourself to process these feelings without judgment.
- Seek Professional Help: Consider counseling or therapy, either individually or as a couple, to navigate the complexities of betrayal.
- Open Communication: If both parties are willing, engage in honest conversations about the reasons behind the cheating and the way forward.
- Rebuild Trust: Trust is fragile and can take time to rebuild. Set boundaries, be transparent, and commit to being trustworthy.
- Self-Care: Prioritize your well-being. Engage in activities that bring you joy and peace.
- Decide the Future: Not all relationships survive infidelity. It’s essential to decide whether to continue together or part ways, ensuring it’s a choice that aligns with your well-being.
Remember, healing from infidelity is a journey, not a destination. With time, support, and effort, it’s possible to find a path forward.