Abortion is always a heavily discussed topic where a lot of numbers are thrown around. In such a manner that it’s typically difficult to understand what is true and what is fake news.
Since abortion is an important topic we have in The Bedbible Research Center decided to do in-depth research that investigates the most popular areas of abortion.
In this research:
- How many abortions per year?
- Age of women that get an abortion?
- Most popular types of abortion?
- How many places offer abortion?
- When do most abortions occur?
- Risks of having an abortion?
- Why do women get an abortion?
- How many abortions are from rape?
- How many abortions are from incest?
- How much does an abortion cost?
- Abortion vs politics (The current state)
Key Findings
- There were 651,231 abortions in the USA in 2023
- 11 out of 1,000 women get an abortion every year
- 1 out of 4 pregnancies end in abortion
- 57.7% of abortions are from women that are 20-29 years old
- 91% of abortions are Medical (before week 9) and Surgical (before week 13) – so in the start
- 1.534 facilities in the US provided abortions in 2023
- 80.9% of abortions occur within the first 9 weeks (Approx. 2 months)
- 0.31 persons for every 100,000 die from an abortion
- The majority of Women (67%) get an abortion because they are a) not ready, b) don’t have the money, or c) don’t want one more child
- The average price of an abortion is 568$
- 64% of US citizens think abortion is a personal medical decision and not something that the state should dictate
- 5 out of 10 abortions happen in an official clinic
- 4 out of 10 abortions were on black women
- 0.5% of abortions are from incest.
- 1% of abortions comes from rape.
How many abortions per year?
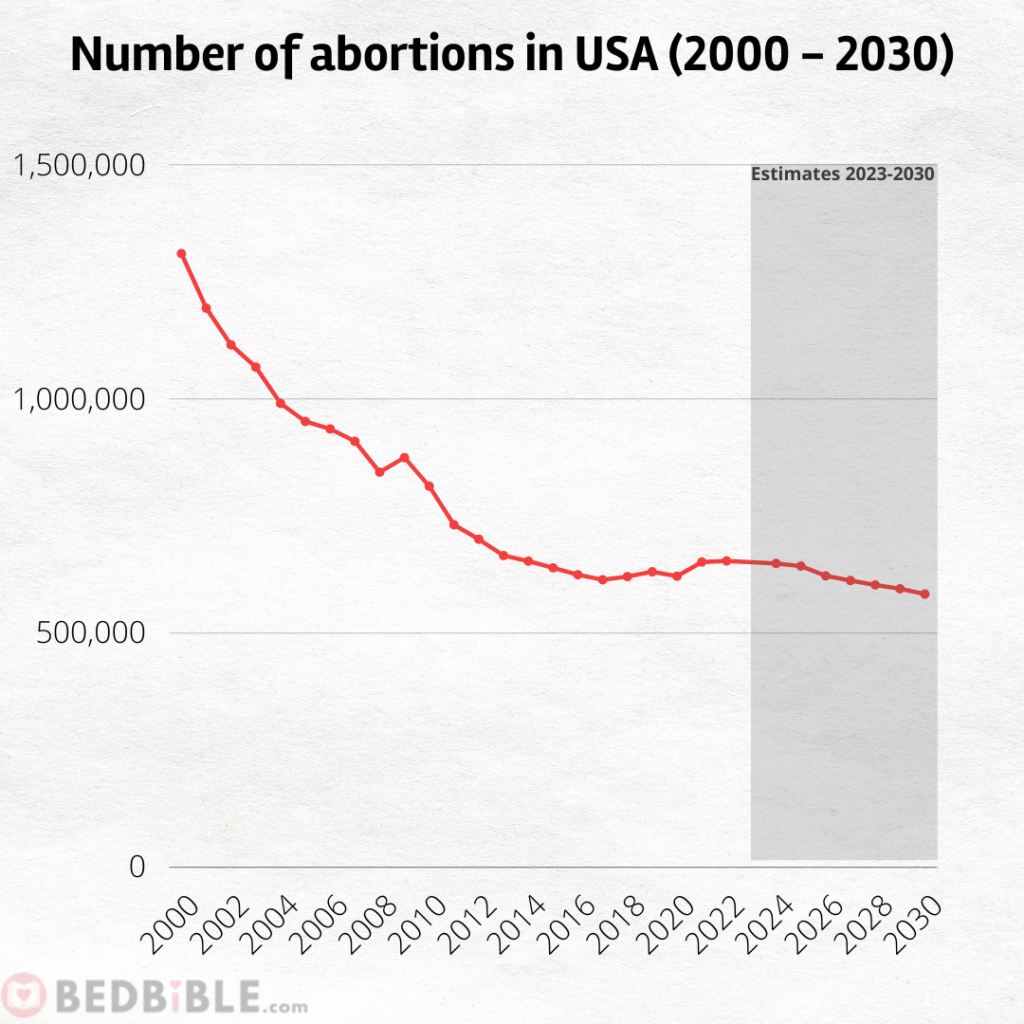
The total number of abortions in the USA is 651,231 in 2023. This is a slight increase from 652,989 in 2022 and 650,729 in 2020. We suspect this increase is due to the COVID-19 effect.
The total number of abortions is decreasing significantly every year. The reasons are among others that; a) we’re becoming a more knowledgeable society. We know what happens if we don’t use some kind of birth control. The amount of pregnancies is also declining. b) politics; a minority of states have closed down the opportunity to get an abortion. c) it’s possible that more and more are self-managing abortions (so basically doing it out of clinics).
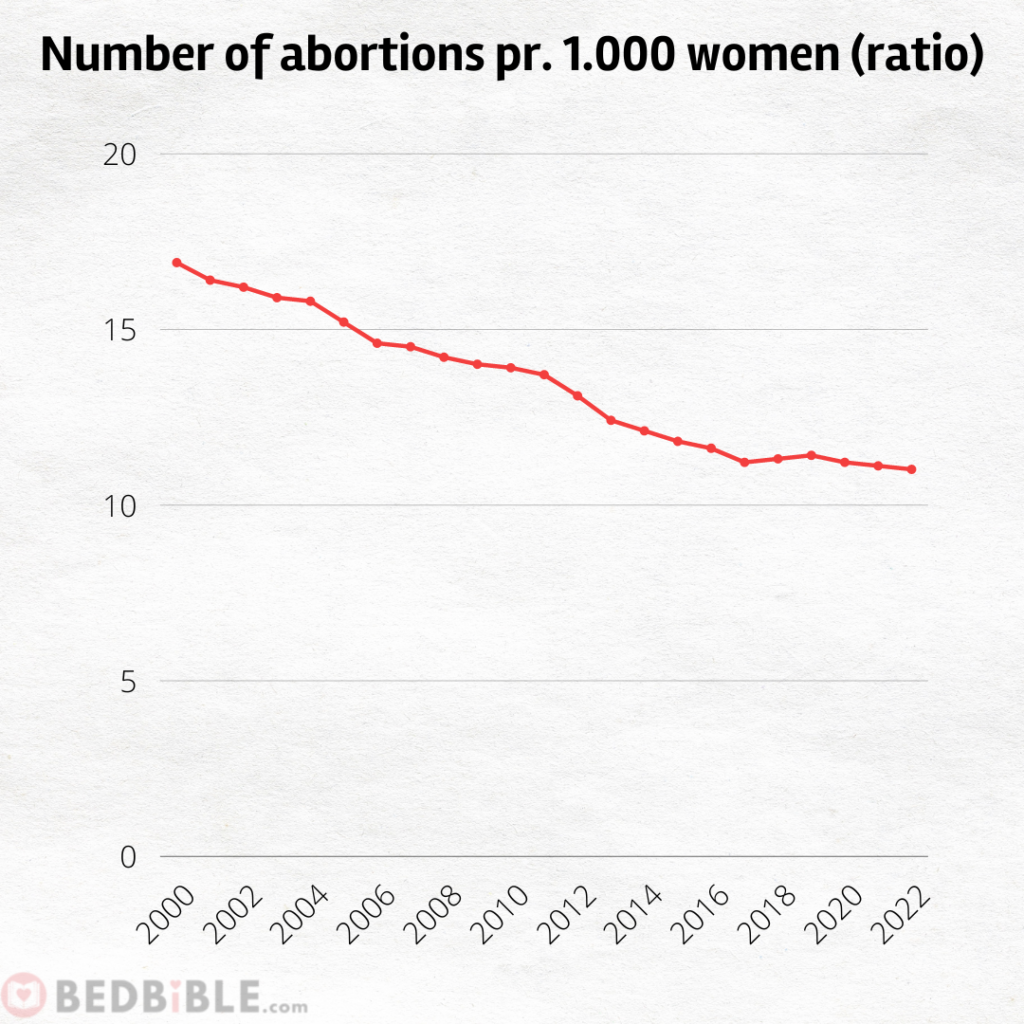
The abortion ratio tells us the same story, that fewer and fewer females are getting an abortion. Only 11 women out of 1.000 in 2023 got an abortion. That number hasn’t been lower.
By country (USA)
| Year | Abortions |
| 2000 | 1,310,000 |
| 2001 | 1,193,660 |
| 2002 | 1,114,872 |
| 2003 | 1,067,520 |
| 2004 | 989,787 |
| 2005 | 951,191 |
| 2006 | 935,245 |
| 2007 | 908,826 |
| 2008 | 842,700 |
| 2009 | 873,882 |
| 2010 | 812,648 |
| 2011 | 730,322 |
| 2012 | 699,202 |
| 2013 | 664,435 |
| 2014 | 652,639 |
| 2015 | 638,169 |
| 2016 | 623,471 |
| 2017 | 612,719 |
| 2018 | 619,591 |
| 2019 | 629,898 |
| 2020 | 620,327 |
| 2021 | 650,729 |
| 2022 | 652,989 |
| 2023 | 651,231 |
| 2024E | 647,533 |
| 2025E | 641,976 |
| 2026E | 621,112 |
| 2027E | 611,092 |
| 2028E | 601,598 |
| 2029E | 593,463 |
| 2030E | 582,171 |
By ratio
| Year | Ratio |
| 2000 | 16.9 |
| 2001 | 16.4 |
| 2002 | 16.2 |
| 2003 | 15.9 |
| 2004 | 15.8 |
| 2005 | 15.2 |
| 2006 | 14.6 |
| 2007 | 14.5 |
| 2008 | 14.2 |
| 2009 | 14 |
| 2010 | 13.9 |
| 2011 | 13.7 |
| 2012 | 13.1 |
| 2013 | 12.4 |
| 2014 | 12.1 |
| 2015 | 11.8 |
| 2016 | 11.6 |
| 2017 | 11.2 |
| 2018 | 11.3 |
| 2019 | 11.4 |
| 2020 | 11.2 |
| 2021 | 11.1 |
| 2022 | 11 |
By race
As it appears, the abortion rate for Black women was 39%, which is the highest among all racial and ethnic groups. The abortion rate for Hispanic women was 21%, while the rate for white women was 33% and the last 7% is categorized into Others. So in other words, 4 out of 10 abortions are on black women.
Here we’ve listed the top 5 states with the most abortions by race in numbers. In other words, e.g. in Vermont, 88% of abortions are on white women, and so on.
Black women
- Mississippi 77%
- Georgia 67%
- Alabama 66%
- Arkansas 54%
- Michigan 54%
Hispanic women
- New Mexico 58%
- Arizona 42%
- Texas 37%
- Connecticut 33%
- Nevada 31%
White women
- Vermont 88%
- West Virginia 84%
- Montana 82%
- Idaho 70%
- Wyoming 68%
| Area | Black | Hispanic | White | Other | Total |
| United States | 39% | 21% | 33% | 7% | 100% |
| Alabama | 66% | 6% | 26% | 2% | 100% |
| Alaska | 7% | 5% | 47% | 41% | 100% |
| Arizona | 12% | 42% | 36% | 10% | 100% |
| Arkansas | 54% | 6% | 37% | 3% | 100% |
| California | N/A | N/A | N/A | N/A | N/A |
| Colorado | N/A | N/A | N/A | N/A | N/A |
| Connecticut | 27% | 33% | 34% | 6% | 100% |
| Delaware | 47% | 14% | 38% | 2% | 100% |
| District of Columbia | 1% | 18% | 16% | 65% | 100% |
| Florida | 38% | 29% | 30% | 4% | 100% |
| Georgia | 67% | 9% | 20% | 5% | 100% |
| Hawaii | N/A | N/A | N/A | N/A | N/A |
| Idaho | 2% | 23% | 70% | 4% | 100% |
| Illinois | N/A | N/A | N/A | N/A | N/A |
| Indiana | 35% | 11% | 47% | 7% | 100% |
| Iowa | N/A | N/A | N/A | N/A | N/A |
| Kansas | 26% | 15% | 52% | 8% | 100% |
| Kentucky | 35% | 8% | 54% | 4% | 100% |
| Louisiana | N/A | N/A | N/A | N/A | N/A |
| Maine | N/A | N/A | N/A | N/A | N/A |
| Maryland | N/A | N/A | N/A | N/A | N/A |
| Massachusetts | N/A | N/A | N/A | N/A | N/A |
| Michigan | 54% | 4% | 37% | 5% | 100% |
| Minnesota | 31% | 7% | 50% | 13% | 100% |
| Mississippi | 77% | 3% | 18% | 2% | 100% |
| Missouri | 32% | 5% | 56% | 8% | 100% |
| Montana | 2% | 6% | 82% | 10% | 100% |
| Nebraska | N/A | N/A | N/A | N/A | N/A |
| Nevada | 22% | 31% | 34% | 12% | 100% |
| New Hampshire | N/A | N/A | N/A | N/A | N/A |
| New Jersey | N/A | N/A | N/A | N/A | N/A |
| New Mexico | 6% | 58% | 26% | 10% | 100% |
| New York | N/A | N/A | N/A | N/A | N/A |
| North California | 52% | 13% | 28% | 7% | 100% |
| North Dakota | N/A | N/A | N/A | N/A | N/A |
| Ohio | N/A | N/A | N/A | N/A | N/A |
| Oklahoma | N/A | N/A | N/A | N/A | N/A |
| Oregon | 6% | 21% | 62% | 11% | 100% |
| Pennsylvania | N/A | N/A | N/A | N/A | N/A |
| Rhode Island | N/A | N/A | N/A | N/A | N/A |
| South Carolina | 43% | 8% | 44% | 5% | 100% |
| South Dakota | N/A | 5% | 64% | N/A | 69% |
| Tennessee | N/A | N/A | N/A | N/A | N/A |
| Texas | 30% | 37% | 27% | 6% | 100% |
| Utah | 5% | 31% | 56% | 8% | 100% |
| Vermont | 5% | 3% | 88% | 5% | 100% |
| Virginia | 47% | 9% | 34% | 10% | 100% |
| Washington | N/A | N/A | N/A | N/A | N/A |
| West Virginia | 14% | 1% | 84% | 2% | 100% |
| Wisconsin | N/A | N/A | N/A | N/A | N/A |
| Wyoming | N/A | 28% | 68% | N/A | 96% |
Age of women who get an abortion?
57.3% of abortions are from women who are 20-29 years old.
More interesting is that the age of 15-19 has gone from 13.5% in 2011 to 8.%, and 25-29 years old has gone from 24.9% to 29.1%. This is an expression of the fact that people are getting older when trying to get a child.
3.5 women out of 100 are less than 15 years old or older than 39 years old when getting a child.
| Age | 2011 | 2012 | 2013 | 2014 | 2015 | 2016 | 2017 | 2018 | 2019 | 2020 | 2021 | 2022 | 2023 |
| <15 | 0.4 | 0.4 | 0.3 | 0.3 | 0.3 | 0.3 | 0.2 | 0.2 | 0.2 | 0.2 | 0.2 | 0.2 | 0.2 |
| 15-19 | 13.5 | 12.2 | 11.4 | 10.4 | 9.8 | 9.4 | 9.1 | 8.8 | 8.7 | 8.3 | 8.2 | 8.1 | 8 |
| 20-24 | 32.9 | 32.7 | 32.7 | 32.1 | 31.1 | 30.0 | 29.3 | 28.5 | 27.8 | 28.1 | 28.2 | 28.3 | 28.2 |
| 25-29 | 24.9 | 25.3 | 25.9 | 26.7 | 27.6 | 28.5 | 29.0 | 29.3 | 29.3 | 29.3 | 29.5 | 29.4 | 29.1 |
| 30-34 | 15.8 | 16.4 | 16.9 | 17.2 | 17.7 | 18.0 | 18.3 | 18.8 | 19.4 | 19.8 | 19.6 | 19.7 | 19.5 |
| 35-39 | 8.9 | 9.1 | 9.2 | 9.7 | 10.0 | 10.3 | 10.5 | 10.7 | 10.9 | 10.6 | 10.8 | 10.9 | 10.5 |
| >39 | 3.6 | 3.8 | 3.6 | 3.6 | 3.6 | 3.6 | 3.6 | 3.6 | 3.7 | 3.6 | 3.4 | 3.3 | 3.3 |
Most popular types of abortion?
There are 6 different ways that hospitals/clinics conduct a professional abortion:
- Surgical <= 13 weeks gestation (Explanation: is a minor operation either awake or sleep)
- Surgical >13 weeks gestation. (Explanation: is a minor operation either awake or asleep)
- Medical <= 9 weeks gestation (Explanation: you take two medications; mifepristone and misoprostol)
- Medical >9 weeks gestation (Explanation: you take two medications; mifepristone and misoprostol)
- Intrauterine instillation (Explanation: instillation abortion is a rarely used method of late-term abortion, performed by injecting a solution into the uterus)
- Hysterectomy (Explanation: surgical removal of the womb (uterus). You’ll no longer be able to get pregnant after the operation. Also known as Sterile)
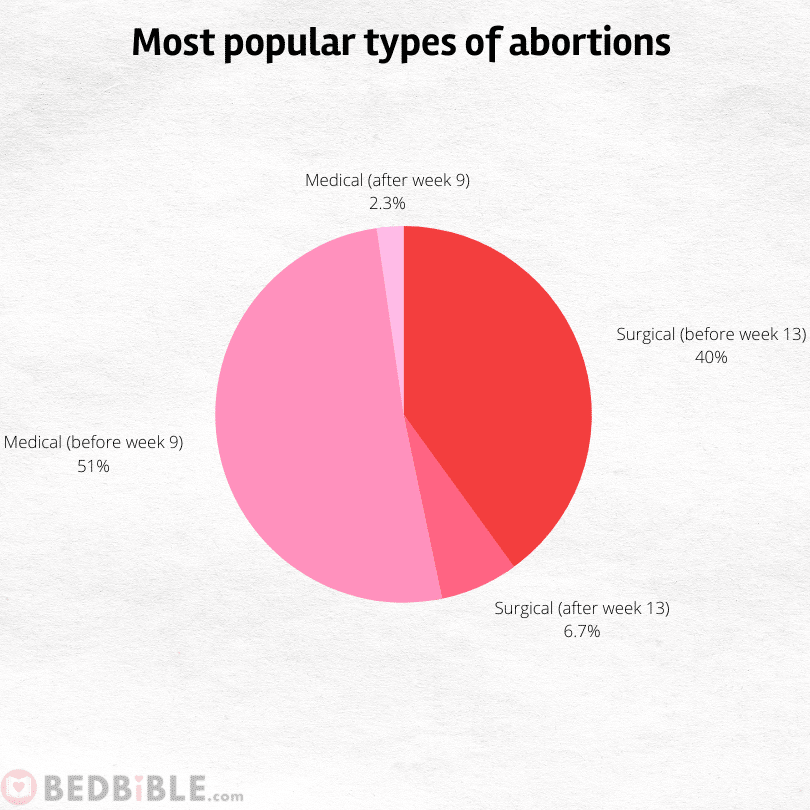
As it appears on the pie chart, 91% of abortions are Medical (before week 9) and Surgical (before week 13).
How many places offer abortion?
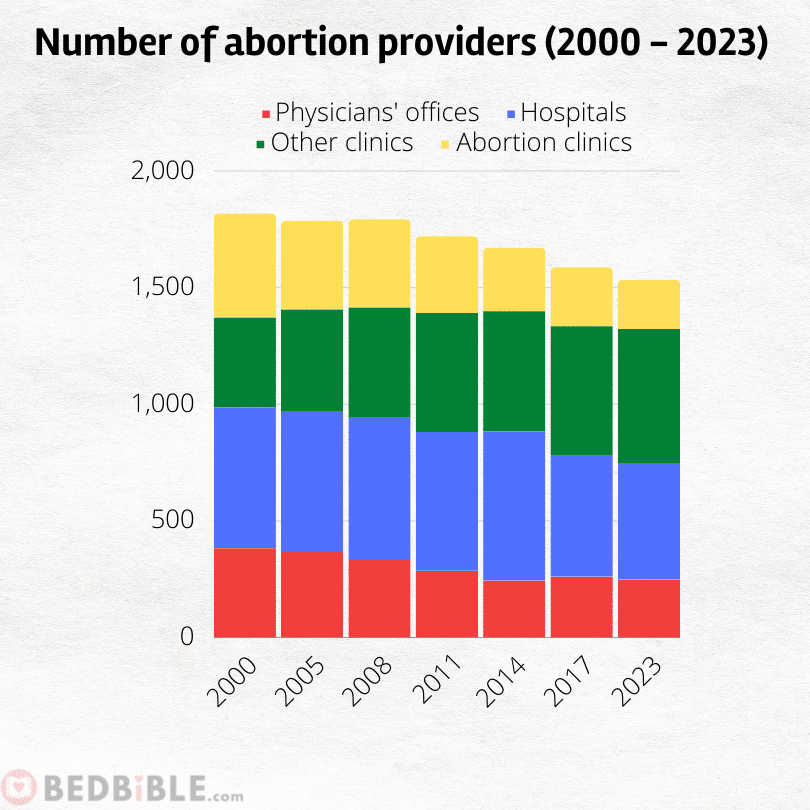
In 2023 there were 1.534 facilities in the US that provide abortions. This is almost half as many as in 1982 when 2.908 providers were registered. The reason for this is a) fewer pregnant and abortions are made and b) providers are getting bigger and more specialized, so there are fewer small and more big providers available.
There are 4 types of abortion places:
- Physicians’ offices
- Hospitals
- Abortion Clinics
- Other clinics
When do abortions occur?
80.9% of abortions occur within the first 9 weeks (2 months).
Only 7 out of 100 abortions occur from week 14 and later on.
This is of course due to the fact that the law makes it more and more difficult to get an abortion the more weeks you’re pregnant.
| <6 weeks | 7-9 weeks | 10-13 weeks | 14-15 weeks | 16-17 weeks | 18-20 weeks | >21 weeks |
| 45.3% | 35.6% | 12.2% | 2.7% | 1.6% | 1.7% | 0.9% |
Risks of having an abortion?
Only 0.31 persons per. 100,000 die from abortion. That is close to nothing.
As you can see below table this statistic has changed a lot since 1973. The primary reason for this is the development in the health sector (we’re more educated and have better equipment/software at hand)
| Year | Total reported deaths | Deaths per 100,000 abortion |
| 1973 – 1977 | 149 | 2.09 |
| 1978 – 1982 | 71 | 0.78 |
| 1983 – 1987 | 59 | 0.66 |
| 1988 – 1992 | 60 | 0.74 |
| 1993 – 1997 | 41 | 0.52 |
| 1998 – 2002 | 42 | 0.63 |
| 2003 – 2007 | 38 | 0.60 |
| 2008 – 2012 | 36 | 0.65 |
| 2013 – 2019 | 30 | 0.43 |
| 2020 – 2023 | 24 | 0.31 |
Why do women get an abortion?
The majority of Women (67%) get an abortion because they are a) not ready, b) don’t have the money, or c) don’t want one more child.
Violence or health problems only account for 8 abortions out of 100. Including rape which accounts for 1 abortion out of 100.
| Percentage | Reason |
| 1% | Rape |
| 3% | Fetal health problems |
| 4% | Physical health problems |
| 4% | Interfere with education or career |
| 7% | Not mature |
| 8% | Don’t want to be a single mom |
| 19% | Don’t want one more child |
| 23% | Economy |
| 25% | Not ready |
| 6% | Other |
How many abortions are from rape?
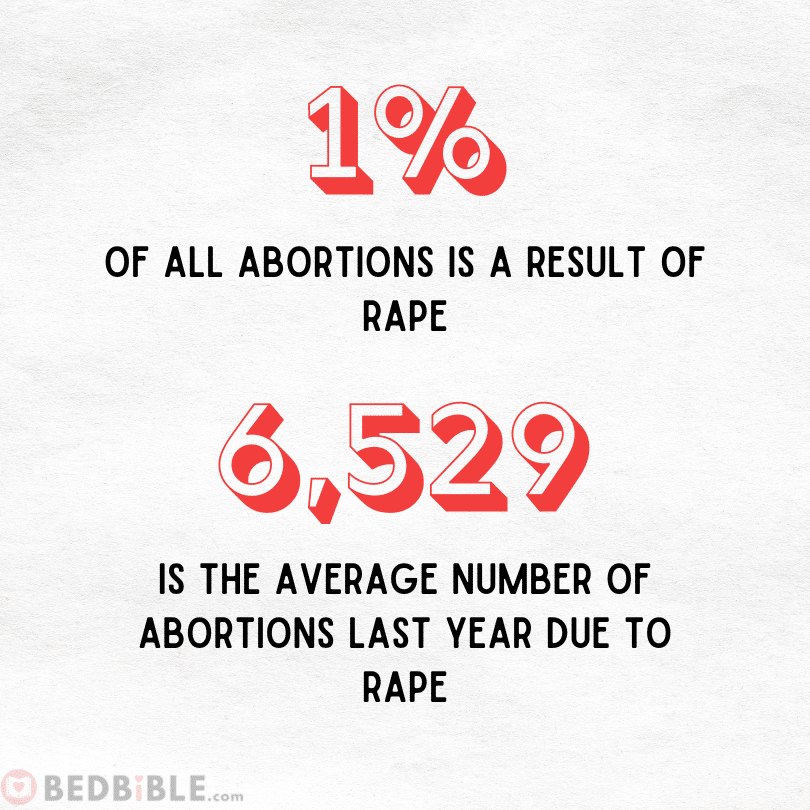
Abortions due to rape have been declining throughout the years, but there are still a few cases every year. But the number could be higher. Earlier studies have shown that 3 out of 4 rapes are not reported, and with that in mind, the number of pregnancies due to rapes is therefore probably even higher than what we know.
What we factually know is that there is 1% of all abortions that is from rape. This is 6,529 females every year that get an abortion.
How many abortions are from incest?
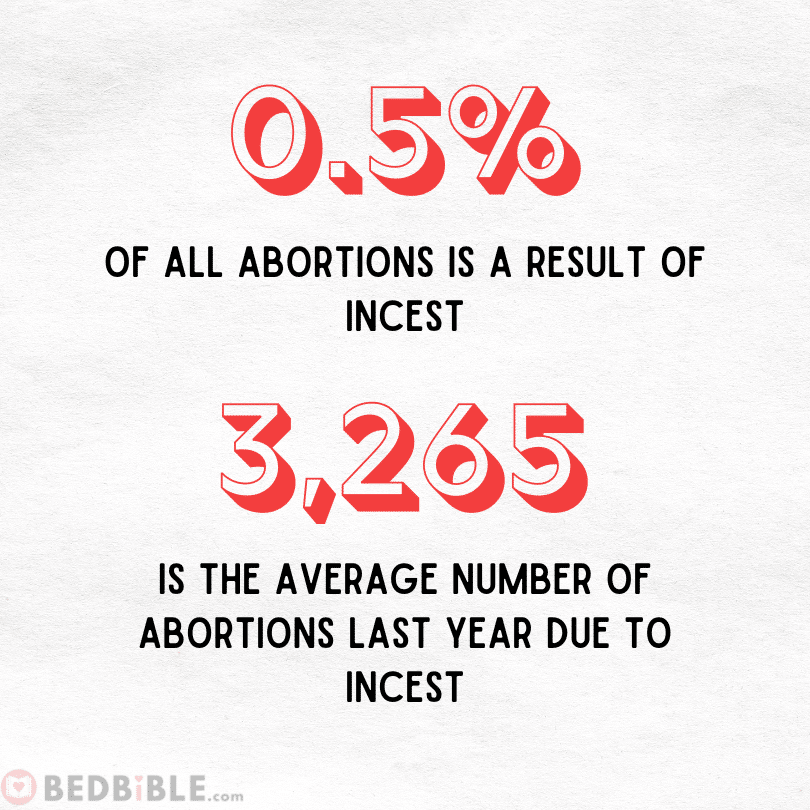
Around 3,265 get every year an abortion due to incest. This is in terms of a percentage of 0.5% of all abortions.
How much does an abortion cost?
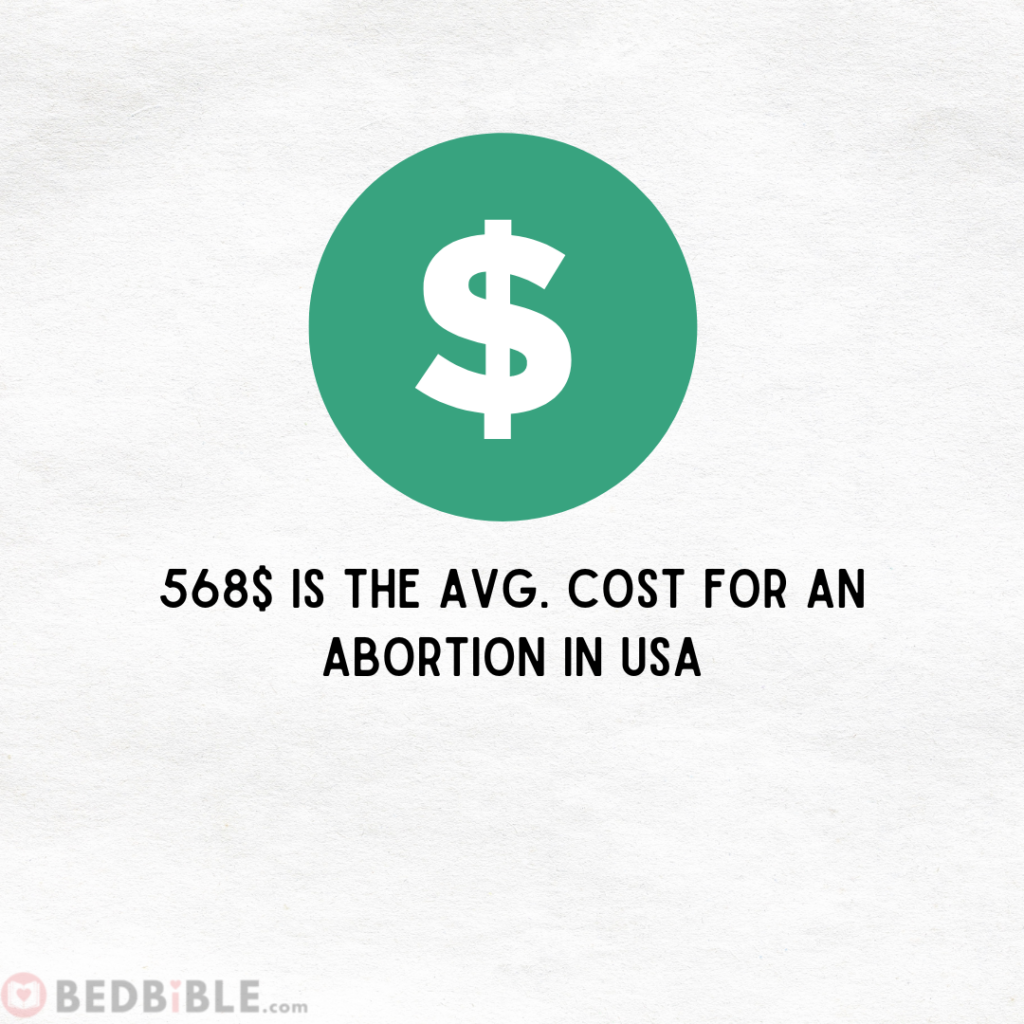
The average price of an abortion is 568$.
The price and cost of abortion are cheaper in the first trimester and more expensive in the second trimester.
If you do not have the money for an abortion. You can apply to abortion funds here: https://abortionfunds.org/
Abortion vs. politics (the current state)
There are many opinions on abortion (especially here in the US). Some are more extreme than others.
Common for all surveys/polls is that the majority (64%) think abortion is a personal medical decision. And did therefore not think that Roe v. Wade should have been overturned.
| Support | Oppose | |
| Making it a crime for a woman to cross state lines to get an abortion that would result in either fines or prison time | 19% | 80% |
| Allowing private citizens to sue people who provide or assist women in getting an abortion | 19% | 80% |
| Making it a crime for a woman to get an abortion that would result in either fines or prison time | 20% | 79% |
| Making it a crime for doctors to perform abortions that would result in either fines or prison time | 26% | 73% |
| Prohibiting abortions once cardiac activity, sometimes known as a fetal heartbeat, is detected, usually around six weeks | 44% | 54% |
| Requiring women to wait 24 hours between meeting with a healthcare provider and getting an abortion | 67% | 32% |
About the lead researcher

Name:
Jacob B.
Recent research:
Description:
I’m Jacob, and I’ve worked on this research for the past 2 months. The work has included coordination of quotes from experts, gathering of data, analyzing the dataset in R, designing figures/graphs, and most importantly reading through the research after it’s done to ensure that it is fact-checked and does not have any errors.
Short about me; I have several years of experience being coordinated in such big research projects. My main priority is to ensure that all Data and methodology are handled according to the best practices. And thereby ensuring that all statistics about abortion are trustworthy and reliable. If you have any questions about the above please reach out to me at: jacob@bedbible.com
