

![Interracial Marriage Statistics [Report: 9 Key Findings]](https://wp.bedbible.com/wp-content/uploads/2024/03/Interracial-Couples-and-Marriage-Statistics.png)
Discover the complexities of interracial marriages in the Bedbible Research Center’s latest study. This detailed report, crafted by our expert team, offers in-depth analysis and insights into the patterns and nuances of these unions. Join us in exploring this significant contribution to understanding societal dynamics, reflecting our commitment to producing reliable and influential research
Here’s what you can find in this article:
- Percent of new marriages that are interracial
- Percent of interracial marriages of all marriages
- Historical approval rates of interracial marriage
- Intermarriage pairings between races and ethnicity
- Intermarriages and divorce rates
Key Findings
- 1 in 5 new marriages are interracial (+19%) in the US
- Interracial marriages increased by 15% from 1967 to the present day
- 11% of all current US marriages are interracial, increasing from 3% in 1967
- Interracial marriages increased significantly from the 1980s to 2000s
- 41% of intermarriages are between whites and Hispanics, 15% are between whites and Asians, and 11% are between whites and blacks
- Asians and native-born Hispanics are most likely to intermarry, with 31% and 41% respectively
- Approval rates for interracial marriages have increased since 1958, with non-white approval rates at 98% and white approval rates at 96%
- Men are less likely to approve of interracial marriages (92%) than women (96%)
- Divorce rates in intermarriages are higher on average but may be influenced by socioeconomic factors, individual characteristics, and cultural contexts rather than solely by the act of intermarriage itself
Percent of new marriages that are interracial
- 1 in 5 new marriages are intermarried (+19%).
- There has been an increase of over 15% from 1967 when only 3% of newlyweds were interracial.
- The increase in the percentage of new marriages that are interracial was especially prevalent from the 1980s to the 2000s. Increasing from 6.7% of newlyweds being interracial to 14.6% in 2008.
If we look at how the pairing is of all the intermarriage newlyweds, we find that:
- 41% of all new intermarriages were between whites and Hispanics
- 15% of all new intermarriages were whites and Asians
- 11% of all new intermarriages were between whites and blacks.
- The remaining 33% of new intermarriages were other combinations, consisting of other racial minority groups, and multi-racial people.
We can also take a look at what races are most likely to engage in intermarriages. Due, to the large majority of Americans being white there is an absolute larger number of whites in intermarriages. Therefore, we look at the numbers on a percentage basis.
- 9% of whites married someone of a race different from their own.
- 16% of blacks married someone of a race different from their own.
- 26% of Hispanics married someone of a race different from their own.
- 31% of Asians married someone of a race different from their own.
Asians are the most likely race to marry someone other than their own.
However, it also goes for native-born Hispanics. 41% of both native-born Hispanics and Asians who are recently married have intermarried. However, compared to foreign-born Hispanics or Asians, only 11% have intermarried.
Percent of interracial marriages (intermarriage) of all marriages
In the data we find, that a fairly large proportion of all marriages are between two different races or ethnicity.
- Today, 11% of all US marriages are interracial.
- The percentage of marriages that are interracial has increased from 3% in 1967 (Loving v. Virginia) to 11% today.
Historical approval rates of interracial marriage
The approval of interracial marriages has been on the rise since 1958. Although we see non-white approval rates capped at 96% (approving of interracial marriages) from 2011 to 2021, it is still higher than the approval rate among whites which is currently 94%.
Here is a table showcasing the data for the race differences in how many percent approve of interracial marriages and couples:
| Survey Year | All | White | Non-white |
|---|---|---|---|
| 1958 | 4% | N/A | N/A |
| 1968 | 20% | 17% | 56% |
| 1972 | 29% | 25% | 61% |
| 1978 | 36% | 33% | 66% |
| 1983 | 43% | 38% | 71% |
| 1991 | 48% | 44% | 70% |
| 1994 | 48% | 45% | 68% |
| 1997 | 64% | 61% | 77% |
| 2002 | 65% | 60% | 78% |
| 2003 | 73% | 71% | 86% |
| 2004 | 76% | 72% | 87% |
| 2007 | 77% | 75% | 85% |
| 2011 | 86% | 83% | 96% |
| 2013 | 87% | 84% | 96% |
| 2021 | 94% | 93% | 96% |
When looking at age differences we find that mainly the younger generations are driving the change, and increases in approval of intermarriages:
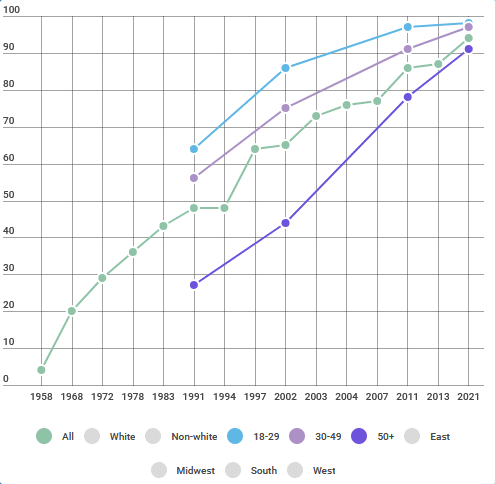
| Survey Year | 18-29 years old | 30-49 years old | 50+ years old |
|---|---|---|---|
| 1991 | 64% | 56% | 27% |
| 2002 | 86% | 75% | 44% |
| 2011 | 97% | 91% | 78% |
| 2021 | 98% | 97% | 91% |
We also see geographical differences in the US, where the lowest approval rates of interracial marriages are found in the South and Midwest, while the highest approval rates can be found in the West and East.
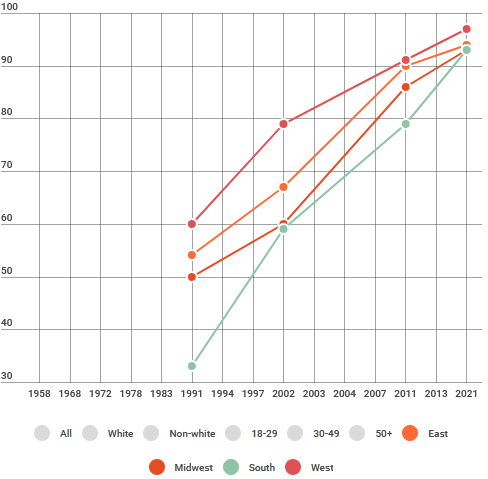
| Year | East | Midwest | South | West |
|---|---|---|---|---|
| 1991 | 54% | 50% | 33% | 60% |
| 2002 | 67% | 60% | 59% | 79% |
| 2011 | 90% | 86% | 79% | 91% |
| 2021 | 94% | 93% | 93% | 97% |
The data also showed that:
- Only 92% of men approve of interracial marriages, while 96% of women do.
- Education is a predictor of how likely Americans are of approving interracial marriages, 92% of people with only high school or less education approve of interracial marriages, while 96% of people with some college education or more approve of intermarriages.
- Republicans are far less likely to approve of intermarriages (89% approval rate), compared to both democrats (98%), and independents (95%).
It was also apparent that approval rates were much higher among non-whites compared to whites:
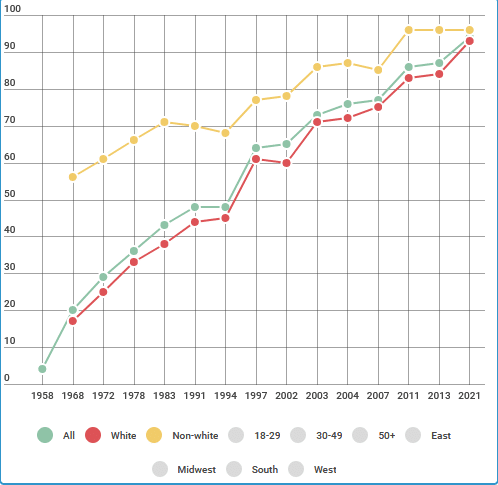
Non-whites’ approval of intermarriages has increased from around 57% approval rate to 98% approval rate today.
In comparison, whites had an approval rate in 1968 of under 20%, which has increased to 96% approval rate of interracial marriages today.
Intermarriage pairings between races and ethnicity
This table shows the percentage of marriages in different racial/ethnic combinations, focusing on the race/ethnicity of husbands and wives. The main findings are:
- White partners tend to marry within their racial group, with 97.7% of White husbands having a White wife, and 97.9% of White wives having a White husband.
- Black partners also predominantly marry within their racial group, with 89.2% of Black husbands having a Black wife, and 95.4% of Black wives having a Black husband.
- Asian partners mainly marry within their racial group, but the rates are lower compared to White and Black partners. 91.8% of Asian husbands have an Asian wife, and 82.5% of Asian wives have an Asian husband.
- Marriages between “Other” partners are more diverse, with 51.0% of Other husbands having an Other wife, and 49.4% of Other wives having an Other husband.
- White-Asian marriages are more common when the husband is White and the wife is Asian, with 1.0% of White husbands having an Asian wife, and 15.3% of Asian wives having a White husband.
- White-Black marriages are more common when the husband is Black and the wife is White, with 0.3% of White husbands having a Black wife, and 8.6% of Black husbands having a White wife.
The table highlights that most marriages are within the same racial/ethnic group. However, there are some variations in the frequency of interracial marriages depending on the specific racial/ethnic combination.
| Race of Husband / Wife | White partner | Black partner | Asian partner | Other partner |
|---|---|---|---|---|
| White Husband | 97.7% | 0.3% | 1.0% | 0.9% |
| White Wife | 97.9% | 0.8% | 0.4% | 0.9% |
| Black Husband | 8.6% | 89.2% | 0.9% | 1.3% |
| Black Wife | 3.9% | 95.4% | 0.2% | 0.4% |
| Asian Husband | 7.0% | 0.3% | 91.8% | 0.9% |
| Asian Wife | 15.3% | 1.1% | 82.5% | 1.1% |
| Other Husband | 44.0% | 1.6% | 3.4% | 51.0% |
| Other Wife | 42.4% | 5.7% | 2.4% | 49.4% |
If we use this data to only look at the pairing distribution amongst all intermarriages we find the following results (presented in a table as well)
Table 1: White Intermarriage Patterns
| Race | White Husband | White Wife |
|---|---|---|
| Black partner | 13.6% | 16.0% |
| Asian partner | 45.5% | 8.0% |
| Other partner | 40.9% | 18.0% |
- White husbands are more likely to intermarry with an Asian partner (45.5%) than a Black (13.6%) or Other partner (40.9%).
- White wives are more likely to intermarry with a Black partner (16.0%) than an Asian (8.0%) or another partner (18.0%).
Table 2: Black Intermarriage Patterns
| Race | Black Husband | Black Wife |
|---|---|---|
| White partner | 7.1% | 3.9% |
| Asian partner | 9.7% | 2.0% |
| Other partner | 13.5% | 4.0% |
- Black husbands are more likely to intermarry with an Other partner (13.5%) than a White (7.1%) or Asian partner (9.7%).
- Black wives are more likely to intermarry with a White partner (3.9%) than an Asian (2.0%) or another partner (4.0%).
Table 3: Asian Intermarriage Patterns
| Race | Asian Husband | Asian Wife |
|---|---|---|
| White partner | 6.5% | 15.1% |
| Black partner | 13.6% | 14.0% |
| Other partner | 16.1% | 14.9% |
- Asian husbands are more likely to intermarry with a Black partner (13.6%) than a White (6.5%) or another partner (16.1%).
- Asian wives are more likely to intermarry with a White partner (15.1%) than a Black (14.0%) or another partner (14.9%).
Table 4: Other Intermarriage Patterns
| Race | Other Husband | Other Wife |
|---|---|---|
| White partner | 2.9% | 6.1% |
| Black partner | 6.1% | 11.5% |
| Asian partner | 15.5% | 9.1% |
- Other husbands are more likely to intermarry with an Asian partner (15.5%) than a White (2.9%) or Black partner (6.1%).
- Other wives are more likely to intermarry with a Black partner (11.5%) than a White (6.1%) or Asian partner (9.1%).
Intermarriages and divorce rates
In today’s increasingly diverse and interconnected society, intermarriage – the act of marrying someone from a different racial, ethnic, or religious background – is on the rise.
However, with growing rates of intermarriage comes a crucial question: how do divorce rates compare between intermarried and intermarried couples?
This section delves into the relationship between intermarriage and divorce rates to paint a clearer picture of the trends and outcomes of mixed marriages.
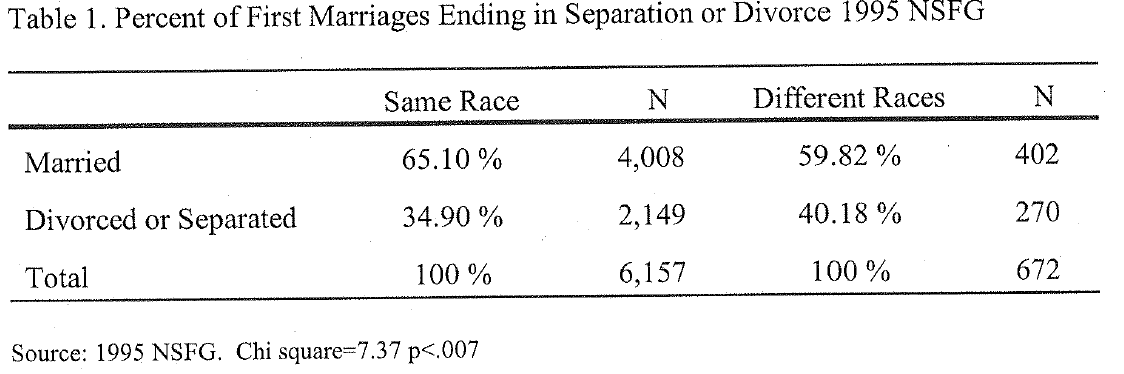
Research on Intermarriage and Divorce Rates
A substantial body of research has explored the relationship between intermarriage and divorce rates. While early studies suggested that intermarried couples were at higher risk of divorce compared to those in intermarriages, more recent research has highlighted the importance of considering the role of socioeconomic factors, individual characteristics, and cultural contexts.
One groundbreaking study published in the Journal of Marriage and Family (2020) analyzed data from the United States and found that when socioeconomic factors and individual characteristics were accounted for, the difference in divorce rates between intermarried and intermarried couples was no longer statistically significant. This suggests that intermarriage, in and of itself, may not inherently lead to a higher risk of divorce. Instead, other factors such as economic stability, education levels, and age at marriage may play a more decisive role.
Cultural Contexts and Divorce Rates in Intermarriages
It is important to recognize that the outcomes of intermarriages may differ depending on the specific cultural contexts in which these unions take place. For example, research has found that divorce rates are generally higher among intermarried couples where one partner is from a more individualistic culture and the other from a more collectivistic culture, compared to those where both partners are from similar cultural backgrounds. These differences can be attributed to varying expectations surrounding family life, gender roles, and relationship dynamics, which may contribute to conflicts or misunderstandings that can ultimately lead to divorce.
Additionally, interreligious marriages can face unique challenges, particularly when spouses hold deeply entrenched religious beliefs. In such cases, disagreements over issues like child-rearing, religious practices, and involvement with religious communities may strain the relationship and contribute to a higher likelihood of divorce.
In conclusion, the relationship between intermarriage and divorce rates is a complex one that is influenced by a range of socioeconomic, individual, and cultural factors. While some research has found higher divorce rates among intermarried couples, these outcomes should not be solely attributed to the act of intermarriage itself. By considering the broader contexts in which mixed marriages take place, we can better understand the challenges and opportunities faced by these couples as they navigate their relationships.