

This article dives into the demographics and experiences of LGBTQ+ individuals in the United States. We’ll explore how many LGBTQ+ individuals live in the country, examining breakdowns by age, generation, ethnicity, socioeconomic status, and education level. We’ll also look at the health of LGBTQ+ Americans, including both general health and mental health concerns like suicide, anxiety, and depression.
Finally, the article will address the issue of discrimination faced by LGBTQ+ individuals in the United States.
Here’s what we’ve covered:
- How Many LGBTQ+ Persons in the US
- By Age
- By Generation
- By Ethnicity
- By Socioeconomics
- By Education
- General Health
- Suicide
- Anxiety and Depression
- Discrimination
Major Findings
- 4.5% of all Americans identify as LGBTQ+ individuals.
- The average age of an LGBTQ+ individual in the U.S. is 37.
- 42% of LGTBQ+ persons in the U.S. are male and 58% are female.
- One in five Gen Z adults identify as LGBTQ+.
- The District of Columbia has the highest percentage of LGTBQ+ individuals at 9.8% of the population. While North Dakota has the lowest at 2.7%.
- 58% of LGBTQ+ persons in the US are white.
- 12% of LGBTQ+ persons in the US are Black.
- 9% of LGTBQ+ individuals in the US are unemployed.
- 41% of LGBTQ+ persons in the US have their High School diploma.
How Many LGBTQ+ Persons in the US
- 4.5% of all Americans identify as LGBTQ+ individuals.
- The average age of an LGBTQ+ individual in the U.S. is 37 years old.
- 42% of LGBTQ+ persons in the U.S. are male and 58% are female.
- 9% of LGBTQ+ individuals are unemployed.
- 15% of LGBTQ+ individuals are uninsured.
- 25% of LGBTQ+ individuals have an annual income level less than $24,000.
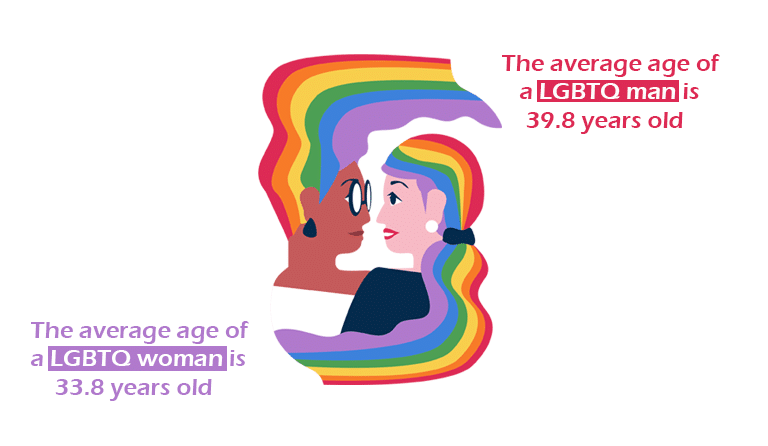
By Age
- The average age of an LGBTQ+ person in the U.S. is 37.3 years old.
- 39.8 years old for men and 33.8 years old for women.
By Generation
- 7.1% Identify as LGBTQ+ in the U.S. (up from 5.6% in 2020).
- One in five Gen Z adults identify as LGBTQ+.
- Bisexual identification is the most common among LGBTQ+ persons.
- Roughly 21% of Generation Z American adults identify as LGBTQ+.
| LGBT (in %) | Straight/Heterosexual (in %) | No response (in %) | |
|---|---|---|---|
| Generation Z (born 1997-2003) | 20.8 | 75.7 | 3.5 |
| Millennials (born 1981-1996) | 10.5 | 82.5 | 7.1 |
| Generation X (born 1965-1980) | 4.2 | 89.3 | 6.5 |
| Baby boomers (born 1946-1964) | 2.6 | 90.7 | 6.8 |
| Traditionalists (born before 1946) | 0.8 | 92.2 | 7.1 |
By Ethnicity
- 58% of LGBTQ+ persons in the US are white.
- 21% of LGBTQ+ persons in the US are Latino/a.
- 12% of LGBTQ+ persons in the US are Black.
- 5% of LGBTQ+ persons in the US are more than one race.
By Socioeconomics
- 9% of LGBTQ+ individuals in the US are unemployed.
- 15% of LGBTQ+ individuals in the US are uninsured.
- 27% of LGBTQ+ individuals in the US are food insecure.
- 25% of LGBTQ+ individuals in the US have an annual income of less than $24,000.
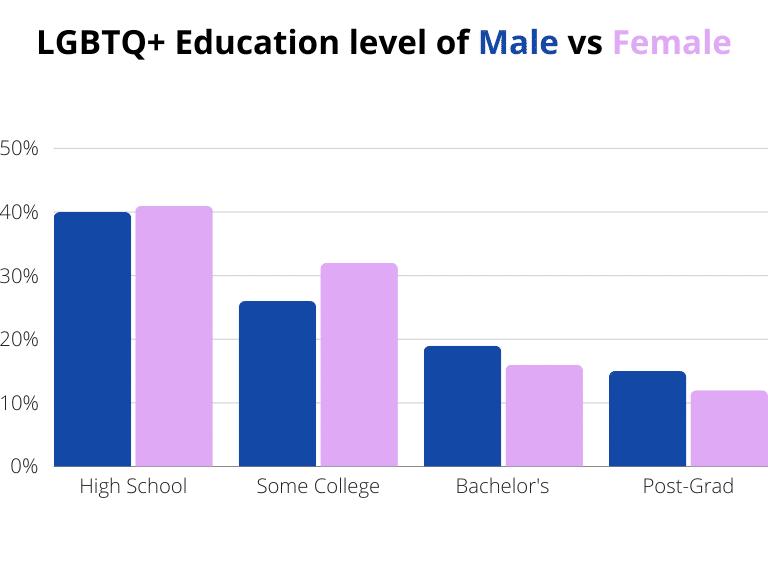
By Education
- 41% of LGBTQ+ persons in the US have their High School diploma.
- 30% of LGBTQ+ persons in the US have Some College.
- 17% of LGBTQ+ persons in the US have a Bachelor’s.
- 13% of LGBTQ+ persons in the US have a Postgraduate level of education.
General Health
- One in eight LGBTQ+ individuals (13%) have experienced some form of unequal treatment from healthcare staff because they’re LGBTQ+.
- Almost one in four LGBTQ+ individuals (23%) have witnessed discriminatory or negative remarks against LGBTQ+ individuals by healthcare staff.
- One in seven LGBTQ+ individuals (14%) have avoided treatment for fear of discrimination because they’re LGBTQ+.
- Seven in ten trans individuals (70%) report being impacted by transphobia when accessing general health services.
- Nearly half of trans individuals (45%) said that their GP did not have a good understanding of their needs as a trans person, rising to over half of non-binary individuals (55%).
- 90% of trans individuals reported experiencing delays when seeking transition-related healthcare.
- Trans individuals of color also experienced transphobia from trans-specific healthcare providers at more than double the rate of white respondents (13% compared to 6%).
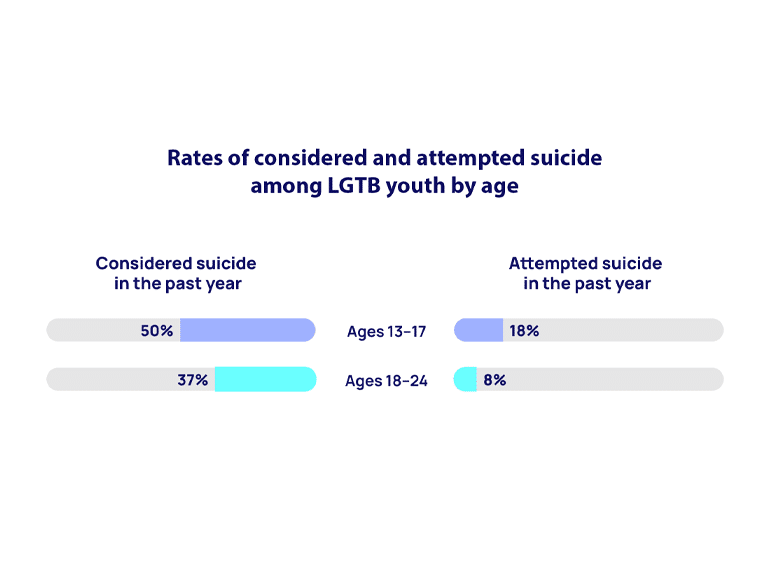
Suicide
- Studies indicate that 45% of LGBTQ+ youth have seriously considered suicide.
- 14% of LGBTQ+ youth have attempted suicide.
- The rate of attempted suicide decreases by less than half the rate in comparison to youth who reported low or moderate social support.
- 73% of LGBTQ+ youth reported feelings of anxiety and 58% reported feelings of depression.
- Less than 1 in 3 non-binary youth describe their home as gender-affirming.
- Significantly lower rates of attempted suicide are found in communities that are described as accepting of LGBTQ+ individuals.
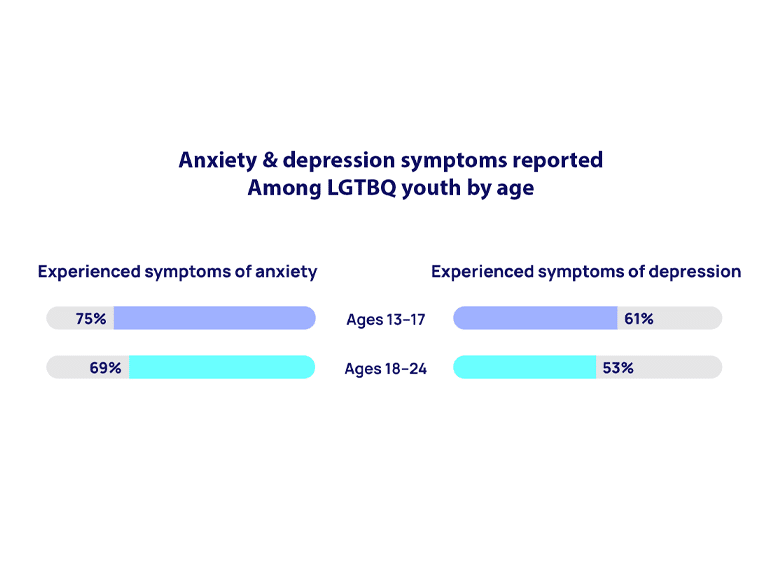
Anxiety and Depression
- 73% of LGBTQ youth report having feelings of anxiety
- 75% are aged 13-17
- 69% are aged 18-24
- 58% of LGBTQ youth report experiencing symptoms of depression
- 61% are aged 13-17
- 53% are aged 18-24
Discrimination
Overview
- More than 1 in 3 LGBTQ+ individuals in the US reported facing discrimination in the past year.
- To avoid discrimination more than 50% of LGBTQ+ in the US report hiding their relationships or identity to avoid discrimination.
Health:
- 1 in 8 LGBTQ+ individuals in Britain report having experienced inequity within the healthcare setting.
Work
- 1 in 5 LGBTQ+ individuals in Britain report being discriminated against when applying for employment.
- More than 1/3 of LGBTQ+ individuals in Britain report feeling the need to hide their sexual orientation within the workplace for fear of being discriminated against.
- 1 in 5 LBGTQ+ individuals: in Britain report being the target of negative comments or discriminatory actions in the workplace.
Education
- 42% of LGBTQ+ students reported being bullied at school in comparison to students who did not identify as LBGTQ+.
- 50% of students identifying as LBGTQ+ reported being subjected to homophobic slurs “often” while at school.
- 9 out of 10 secondary teachers and almost 5 out of 10 primary teachers report that their LGBTQ+ students have been subjected to bullying.
Hate Crimes
- 2/3 of LGBTQ+ individuals have been the victim of a hate crime in the form of violence or abuse.
- 9/10 experienced verbal abuse, 3/10 physical abuse and 2/10 experienced sexual violence.
International
- It is illegal to be LGBTQ+ in 70 countries.
- In 11 of these countries, being LGBTQ+ has a possible punishment of the death penalty.
- 25% of the world’s population believes that being LGBTQ+ should be a crime.
Sources: Williamsinstitute.law.ucla.edu, Gallup.com, Stonewall.org.uk, Thetrevorproject.org, and Americanprogress.org.