


How often do people really have sex? Our report, “Sex Frequency Statistics,” dives into the intimate details of sexual activity across different populations. Drawing on extensive data sources, we explore variations in sex frequency due to factors like age and relationship status. This analysis not only demystifies common perceptions but also provides a clearer picture of the sexual habits that define contemporary life.
Table of contents:
- Sex frequency of singles + couples (per month, by age and gender)
- Sex frequency of couples (per month, by age and gender)
- Sex frequency of singles (per month, by age and gender)
- Number of times couples have sex (per month, by age group)
- How often do married couples have sex
- Sex frequency for couples (per year)
- Average Sexual Frequency of Americans (per week, by relationship status)
- Average Number of Times Couples Have Sex (Per Week)
- Sex Frequency of People Between Ages 50-80
Key Takeaways
- People on average have sex 3.9 times per week.
- 25% have sex every week.
- People are having less sex (measured on a year-by-year basis from 1989 to 2023).
- By age groups:
- The most sexually active age group is 25-34, where people have sex on average 7.3 times per month.
- 50-80 year olds report to have sex twice a month (on average).
- By Relationship Status:
- Couples on average have sex 5.8 times per month.
- Married couples on average have sex less frequently (5.2 times per month).
- 26% of couples report having sex once a week on average.
- Singles on average have sex 2.2 times per month.
- 7% of couples report only having had sex 1-2 times in the past year.
- Couples younger than 24 are the age group that has sex most often (9.1 times per month).
Sex frequency of singles + couples (per month, by age and gender)
First, some data on all people (no matter the relationship status):
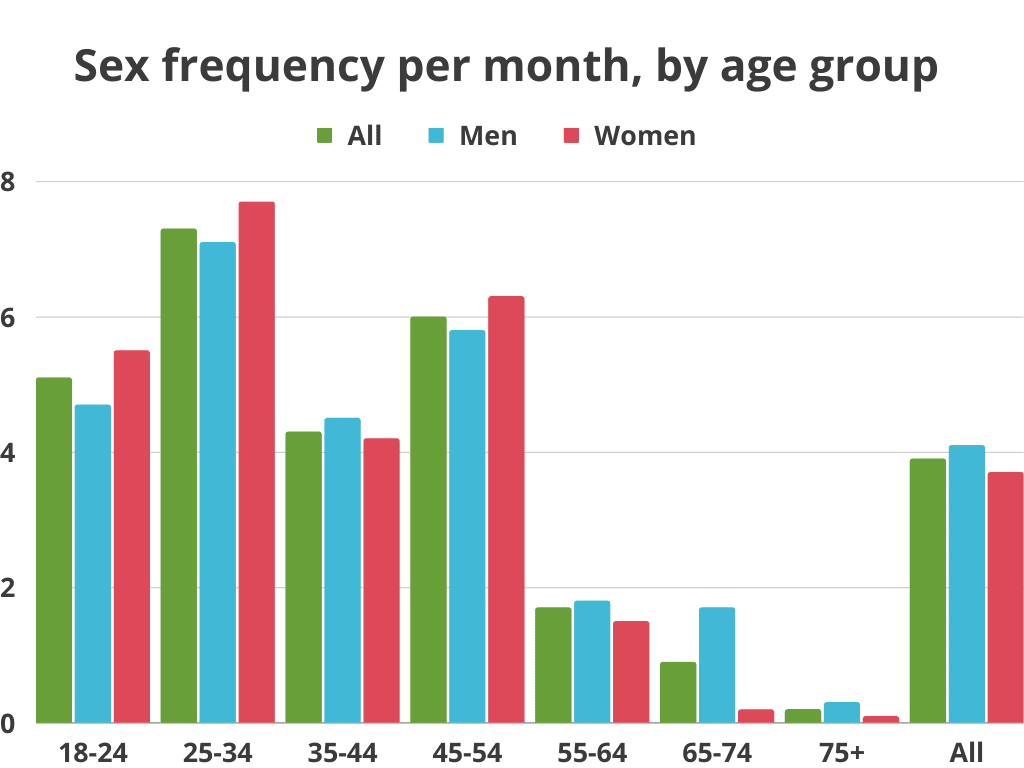
| All, Age groups | Sex Frequency per month | | | Men | Women |
|---|---|---|---|---|
| 18-24 | 5.1 | | | 4.7 | 5.5 |
| 25-34 | 7.3 | | | 7.1 | 7.7 |
| 35-44 | 4.3 | | | 4.5 | 4.2 |
| 45-54 | 6.0 | | | 6.3 | 5.8 |
| 55-64 | 1.7 | | | 1.8 | 1.5 |
| 65-74 | 0.9 | | | 1.7 | 0.2 |
| 75+ | 0.2 | | | 0.3 | 0.1 |
| All | 3.9 | | | 4.1 | 3.7 |
Sex frequency of couples (per month, by age and gender)
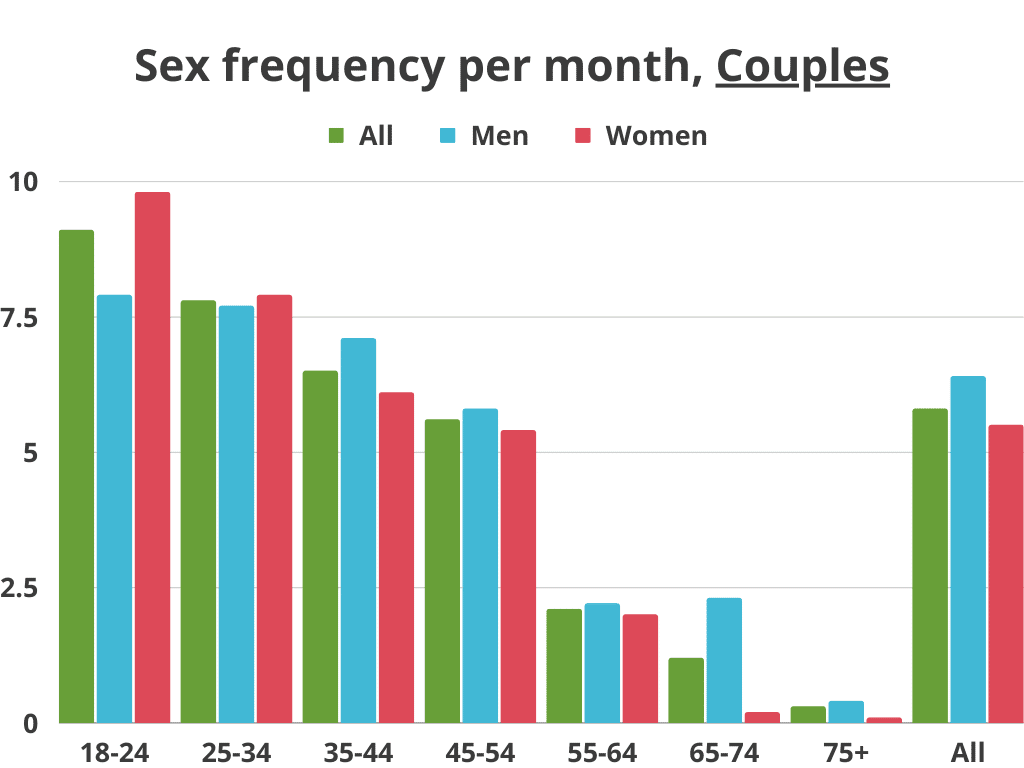
| Couples, by age groups | Sex Frequency per month, | | | Men | Women |
|---|---|---|---|---|
| 18-24 | 9.1 | | | 7.9 | 9.8 |
| 25-34 | 7.8 | | | 7.7 | 7.9 |
| 35-44 | 6.5 | | | 7.1 | 6.1 |
| 45-54 | 5.6 | | | 5.8 | 5.4 |
| 55-64 | 2.1 | | | 2.2 | 2.0 |
| 65-74 | 1.2 | | | 2.3 | 0.2 |
| 75+ | 0.3 | | | 0.4 | 0.1 |
| All | 5.8 | | | 6.4 | 5.5 |
Sex frequency of singles (per month, by age and gender)
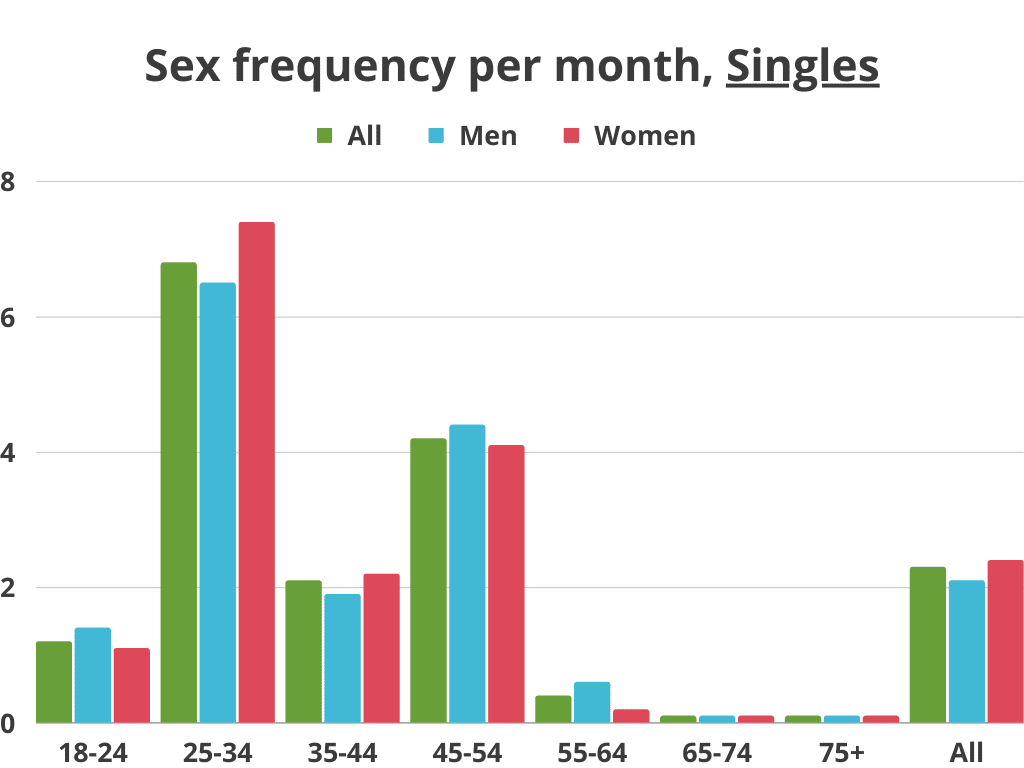
| Singles, by age groups | Frequency per month | | | Men | Women |
|---|---|---|---|---|
| 18-24 | 1.2 | | | 1.4 | 1.1 |
| 25-34 | 6.8 | | | 6.5 | 7.4 |
| 35-44 | 2.1 | | | 1.9 | 2.2 |
| 45-54 | 4.2 | | | 4.4 | 4.1 |
| 55-64 | 0.4 | | | 0.6 | 0.2 |
| 65-74 | 0.1 | | | 0.1 | 0.1 |
| 75+ | 0.1 | | | 0.1 | 0.1 |
| All | 2.2 | | | 2.1 | 2.4 |
Number of times couples have sex (per month, by age group)
In the first statistical chart of sexual activity, we included all intercourse recordings of couples (of all types). Then we averaged this number out over a full month.
Additionally, we split the data up by age groups.
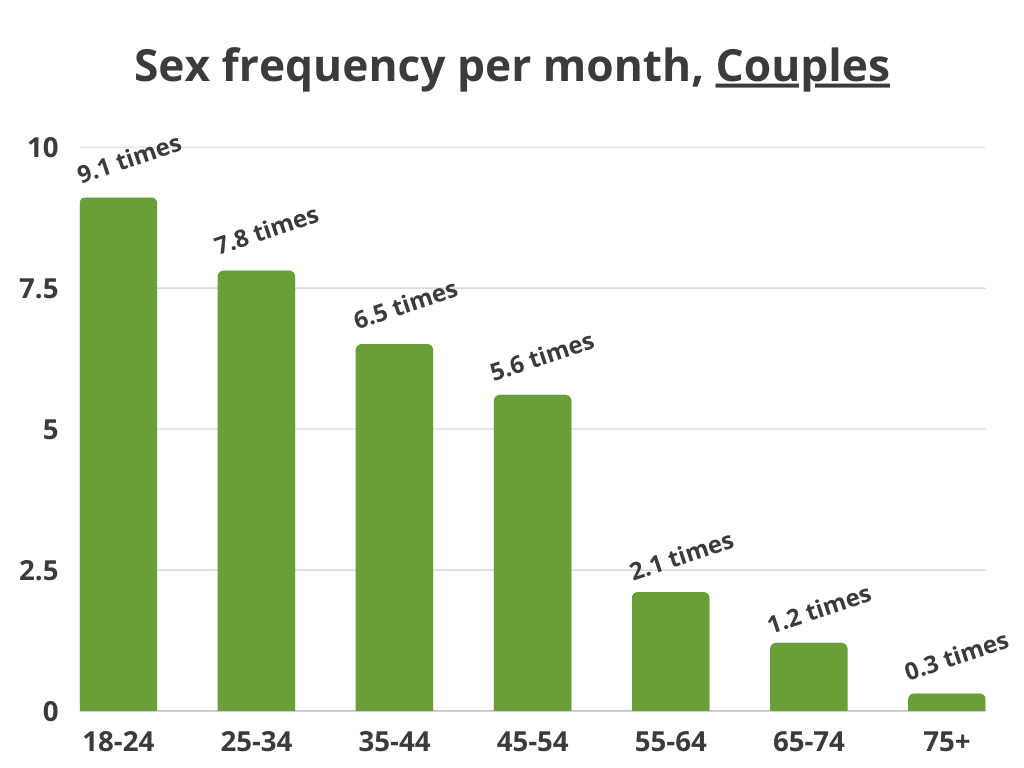
- On average couples have sex 1.4 times per week (5.8 times per month).
- The most sexually active couples are between 18 and 24, and they have sex 2.1 times per week on average.
- The least sexually active couples are 75+ who have sex on average every 3-4 months (0.3 times per month).
| Couples, by age groups | Sex frequency per month | Per week |
|---|---|---|
| 18-24 | 9.1 | 2.1 |
| 25-34 | 7.8 | 1.8 |
| 35-44 | 6.5 | 1.5 |
| 45-54 | 5.6 | 1.3 |
| 55-64 | 2.1 | 0.5 |
| 65-74 | 1.2 | 0.3 |
| 75+ | 0.3 | 0.1 |
| All | 5.8 | 1.4 |
What the data showed is that:
- Couples on average have sex 1.4 times per week.
- Couples aged 18-24 have sex on average 2.1 times per week.
- Couples aged 25-34 have sex on average 1.8 times per week.
- Couples aged 35-44 have sex on average 1.5 times per week.
- Couples aged 45-54 have sex on average 1.3 times per week.
- Couples aged 55-64 have sex on average 0.5 times per week.
- Couples aged 65-74 have sex on average 0.3 times per week.
- Couples aged 75+ have sex on average 0.1 times per week.
How often do married couples have sex
In this section, we took a look at the difference between married and unmarried couples.
This allowed us to see if there is a correlation between sex frequency and married status across different age groups.
What we found is that:
- Married couples on average have sex 5.9 times per month (1.4 times per week).
- Unmarried couples have sex on average 5.4 times per month.
- Married couples have sex on average 0.5 times more per month than unmarried couples.
- Unmarried couples over 40 years old have sex more frequently than married couples of similar age.
The last part of the statistics can be explained by the fact that after 40, unmarried couples are often also new couples where sex frequency is often higher than long-term couples.

| Couples, by age groups | Married, per month | Unmarried, per month | All |
|---|---|---|---|
| 18-24 | 10.9 | 7.1 | 9.1 |
| 25-34 | 8.6 | 6.2 | 7.8 |
| 35-44 | 5.8 | 7.2 | 6.5 |
| 45-54 | 5.1 | 6.8 | 5.6 |
| 55-64 | 1.7 | 3.1 | 2.1 |
| 65-74 | 1.1 | 2.3 | 1.2 |
| 75+ | 0.3 | 0.5 | 0.3 |
| All | 5.2 | 5.4 | 5.3 |
We have also added the same-sex frequency chart for the weekly frequencies:
| Couples, by age groups | Married, per week | Unmarried, per week | All |
|---|---|---|---|
| 18-24 | 2.5 | 1.6 | 2.1 |
| 25-34 | 2.0 | 1.4 | 1.8 |
| 35-44 | 1.4 | 1.7 | 1.5 |
| 45-54 | 1.2 | 1.6 | 1.3 |
| 55-64 | 0.4 | 0.7 | 0.5 |
| 65-74 | 0.2 | 0.5 | 0.3 |
| 75+ | 0.1 | 0.1 | 0.1 |
| All | 1.2 | 1.3 | 1.2 |
What this shows is that:
- Unmarried couples have sex on average 1.3 times per week, while married couples only have sex 1.2 times per week.
- For couples aged 18-24: Unmarried couples have sex on average 1.6 times per week, while married couples only have sex 2.5 times per week.
- For couples aged 25-34: Unmarried couples have sex on average 1.4 times per week, while married couples only have sex 2.0 times per week.
- For couples aged 35-44: Unmarried couples have sex on average 1.7 times per week, while married couples only have sex 1.4 times per week.
- For couples aged 45-54: Unmarried couples have sex on average 1.6 times per week, while married couples only have sex 1.2 times per week.
- For couples aged 55-54: Unmarried couples have sex on average 0.7 times per week, while married couples only have sex 0.4 times per week.
- For couples aged 65-74: Unmarried couples have sex on average 0.5 times per week, while married couples only have sex 0.2 times per week.
- For couples aged 75+: Unmarried couples have sex on average 0.1 times per week, while married couples only have sex 0.1 times per week.
Sex frequency for couples (per year)
- The average American couple has sex 73 times per year.
- Couples younger than 34 years old have sex on average 103 times per year.
- Couples aged 18-24 years old have sex on average 109 times per year.
- Couples aged 25-34 years old have sex on average 94 times per year.
- Couples aged 35-44 years old have sex on average 78 times per year.
- Couples aged 45-54 years old have sex on average 68 times per year.
- Couples aged 55-64 years old have sex on average 26 times per year.
- Couples aged 65-74 years old have sex on average 16 times per year.
- Couples 75 years or older have sex on average 5-6 times per year.
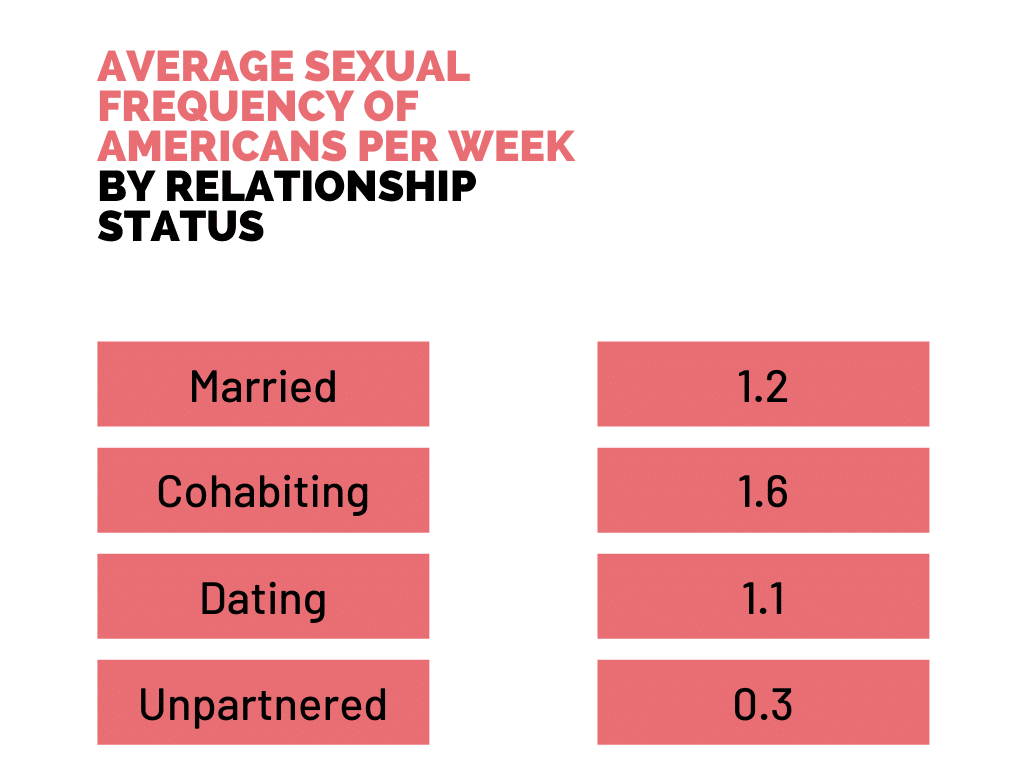
Average Sexual Frequency of Americans (per week, by relationship status)
- Married (1.2 times per week)
- Cohabiting couples (1.6 times per week)
- Dating (1.1 times per week)
- Unpartnered (0.3 times per week)
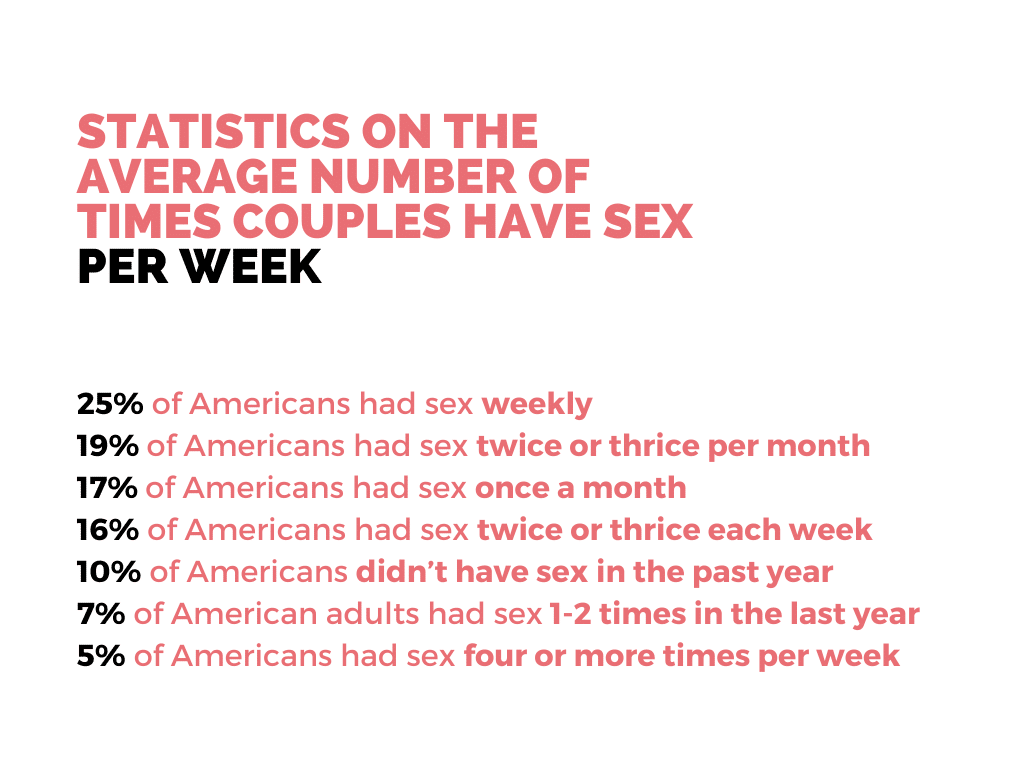
Average Number of Times Couples Have Sex (Per Week)
- 25% of Americans had sex weekly
- 19% of Americans had sex twice or thrice per month
- 17% of Americans had sex once a month
- 16% of Americans had sex twice or thrice each week
- 10% of Americans didn’t have sex in the past year
- 7% of American adults had sex 1-2 times in the last year
- 5% of Americans had sex four or more times per week
Sex Frequency of People Between Ages 50-80
- On average, people who are between 50-80 years old have sex two times a month
- 37% of individuals aged 50-80 were reported not having sex anymore
- 27% said that they had sex at least once per month
- 14% of the singles in the age group 50-80 said that they were down to have sex on the first date
- 30% of the singles in the same age group stated that they had sex within the first three dates
Find more stats on what happens in terms of the sex you have when you are 70 years old or older here