

![How Many Marriages are Sexless [Statistics]](https://wp.bedbible.com/wp-content/uploads/2023/11/How-Many-Marriages-are-Sexless-Statistics.png)
Are you curious about the silent dynamics many couples face in their private lives? Our latest report sheds light on the intriguing topic of sexless marriages, revealing just how many couples navigate this quiet challenge. With compelling statistics and key findings, this report not only quantifies the phenomenon but also explores its implications on relationships. Dive into the data and discover what lies beneath the surface of marital intimacy.
Contents of this report:
Top Findings
- 15.6% of married individuals hadn’t had sex the previous year (an increase from 1.9% in 1994).
- 74.2% of sexless marriages end in divorce.
- In the US there are 20.4 million individuals living in sexless marriages.
- Married couples under 30 have sex on average 111 times a year (more than twice a week).
- Married couples, who have been together over 30 years are on average 35 times more likely to be in a sexless marriage than newlyweds (max 2 years married).
- 77% of those in sexless marriages say they would want more sex.
- The 2 most important reasons why couples stop having sex are: 1) Fading away enthusiasm and 2) Long work hours
By Years Married
Of course, it is not in every group and even for all the newlyweds where the percentages are that high.
- 5.6% of marriages that have lasted 0-10 years are sexless.
- 13.7% of marriages that have lasted 10-20 years are sexless.
- 20.1% of marriages that have lasted 20-30 years are sexless.
- 28.9% of marriages that have lasted 30-40 years are sexless.
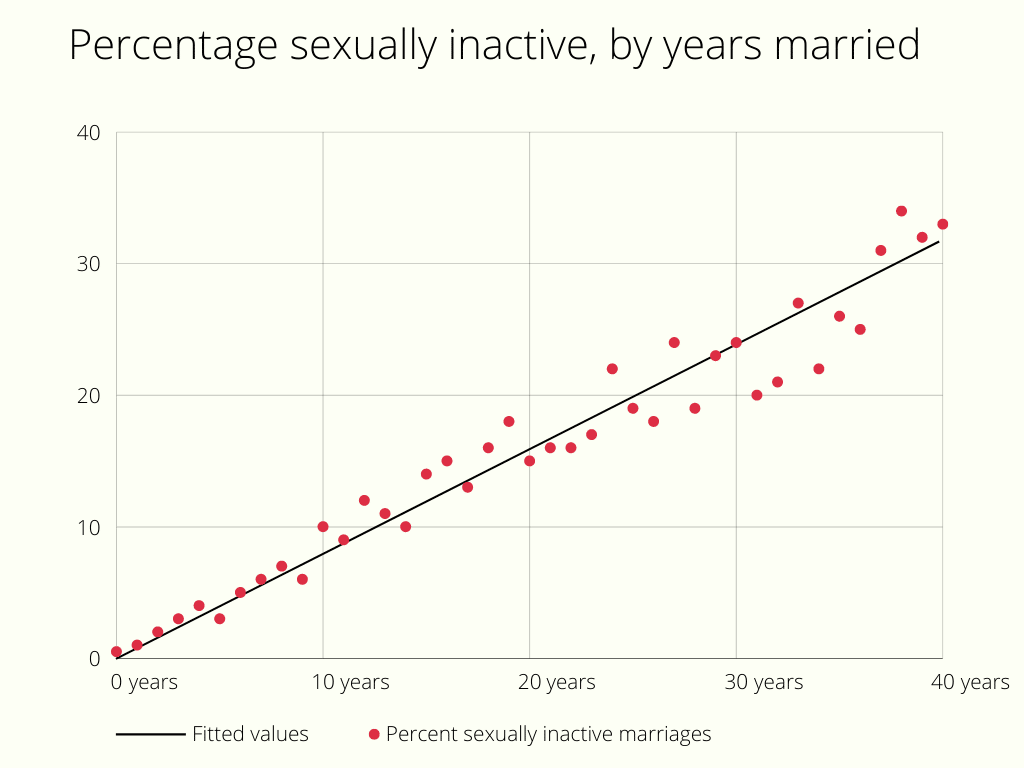
However! There is no statistical correlation between sexually inactive marriages and the number of years couples have been married.
How? You might ask. Well, because the primary determinant of a sexless marriage is not the number of years it has lasted but rather age.
When we control for the age of the married couples in our statistical model we find that there is a positive correlation between sexual activity and several years of marriage. In other words:
- The longer you have been married, the more likely you are to have sex, when compared to others at your age.
Said in another way: Respondents who are the same age—but who have been married longer—are less likely to be sexually inactive than their comparable-age peers who were married more recently.
That being said, when you look at the actual numbers, there is a clear correlation (it does however not mean causation).
That also goes for the number of times couples have sex on average:
- Marriages that have lasted 0-10 years have sex on average 107 times a year.
- Marriages that have lasted 10-20 years have sex on average 69 times a year.
- Marriages that have lasted 20-30 years have sex on average 42 times a year.
- Marriages that have lasted 30-40 years have sex on average 36 times a year.
Note: we don’t have enough data to reliably give an estimate on marriages of +40 years.
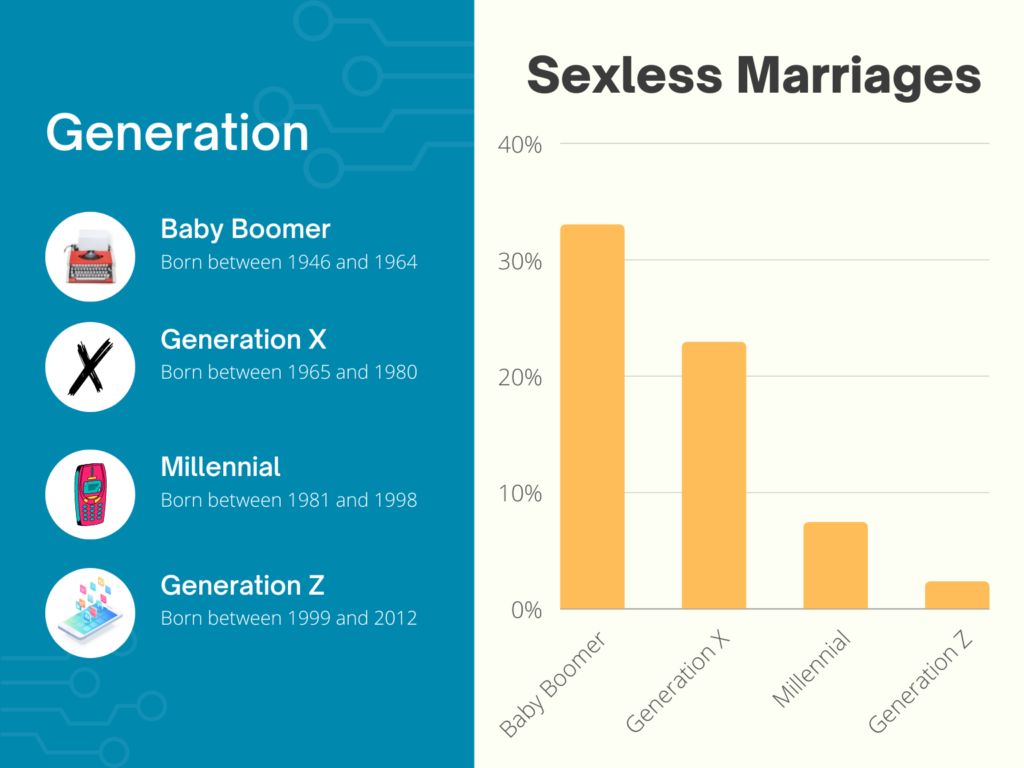
By Generation
Having shown the clear correlation between the number of years of marriage and the percentage of sexless marriages, it became clear from the analysis that the main determinant of sex in marriages is age.
To make the causality between age and being in a sexless marriage here are the data for the 4 big generations:
- 33.1% of the Baby Boomer generation (born 1946-1964) that are married live in a sexless marriage
- 22.9% of the Generation X generation (born 1965-1980) that are married live in a sexless marriage
- 7.4% of the Millenial generation (born 1981-1998) that are married live in a sexless marriage.
- 2.3% of the Generation Z generation (born 1999-2012) that are married live in a sexless marriage.
By Age
- 3.5% of 20-year-olds in marriage report not having sex in the past year
- 4.6% of 25-year-olds in marriage report not having sex in the past year
- 6.5% of 30-year-olds in marriage report not having sex in the past year
- 7.9% of 35-year-olds in marriage report not having sex in the past year
- 15.6% of 40-year-olds in marriage report not having sex in the past year
- 19.8% of 45-year-olds in marriage report not having sex in the past year
- 23.9% of 50-year-olds in marriage report not having sex in the past year
- 25.8% of 55-year-olds in marriage report not having sex in the past year
- 29.1% of 60-year-olds in marriage report not having sex in the past year
- 32.0% of 65-year-olds in marriage report not having sex in the past year
- 34.1% of 70-year-olds in marriage report not having sex in the past year
Note: we did not have reliable data on the rest of the dataset (>75 year olds)
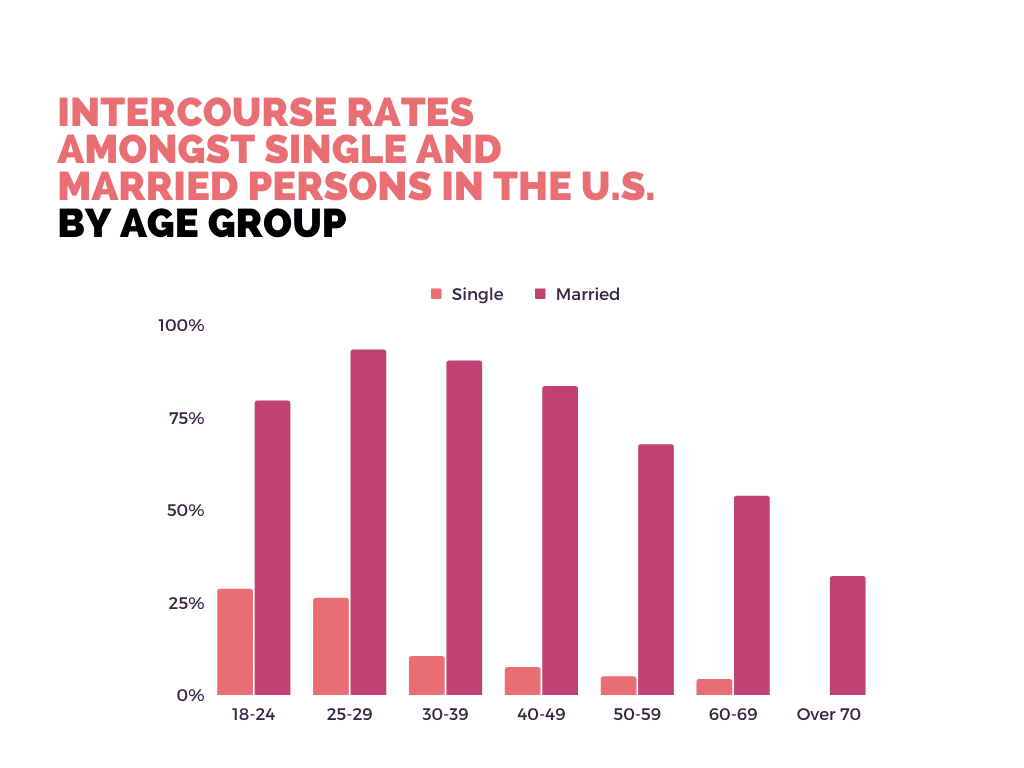
Married vs. Singles
We asked both single and married individuals if they were sexless (had sex in the past year). And in age brackets and comparable the answers are:
Married
- Among 18-24 year olds 79.4% report that they had sex in the past year
- Among 25-29 year olds 93.2% report that they had sex in the past year
- Among 30-39 year olds 90.2% report that they had sex in the past year
- Among 40-49 year olds 83.3% report that they had sex in the past year
- Among 50-59 year olds 67.6% report that they had sex in the past year
- Among 60-69-year-olds 53.7% report that they had sex in the past year
- Among individuals over 70 years old 31.9% report that they had sex in the past year
Singles
- Among 18-24 year olds 28.6% report that they had sex in the past year
- Among 25-29 year olds 26.2% report that they had sex in the past year
- Among 30-39 year olds 10.5% report that they had sex in the past year
- Among 40-49 year olds 7.5% report that they had sex in the past year
- Among 50-59 year olds 5% report that they had sex in the past year
- Among 60-69 year olds 4.3% report that they had sex in the past year
- Among individuals over 70 years old 0.3% report that they had sex in the past year
Why Do Couples Stop Having Sex
All respondents were asked on a 1-5 scale how much they agreed that each of the 68 reasons was likely to cause them difficulties in keeping an intimate relationship.
The scores for all factors are aggregated and weighted under each factor.
The mean scores for each factor are listed in the Table.
The results of what reasons people believe are most likely to cause them difficulties in having sex are listed in the below table:
| # | Factor | Overall (Mean) ↓ | Women (Mean) | Men (Mean) |
|---|---|---|---|---|
| 1 | Fading away enthusiasm | 2.68 | 2.62 | 2.76 |
| 2 | Long work hours | 2.66 | 2.59 | 2.73 |
| 3 | Lack of personal time and space | 2.61 | 2.50 | 2.73 |
| 4 | Character issues | 2.57 | 2.64 | 2.49 |
| 5 | Clinginess | 2.51 | 2.52 | 2.50 |
| 6 | Bad sex | 2.50 | 2.46 | 2.55 |
| 7 | Infidelity and abuse | 2.28 | 2.28 | 2.29 |
| 8 | Children | 2.24 | 2.26 | 2.22 |
| 9 | Lack of effort | 2.22 | 2.13 | 2.31 |
| 10 | Social circle issues | 2.15 | 2.11 | 2.21 |
| 11 | Not monogamous | 2.12 | 1.94 | 2.32 |
| 12 | Behavioral issues | 1.76 | 1.72 | 1.81 |
Interested in more stats about marriages?
Take a look at the Bedbible Research Center’s other reports on marriages: