

![Tinder Statistics [User Demographics]](https://wp.bedbible.com/wp-content/uploads/2024/04/Tinder-statistics.png)
In the ever-evolving landscape of digital dating, Tinder stands out as a pivotal platform connecting millions of users worldwide. This report dives deep into the core statistics that define Tinder’s impact and usage. From user demographics and behavior patterns to success stories and common challenges, we cover all the essential data you need to understand how Tinder is shaping the modern dating scene.
Highlighted topics covered in this report:
- Usage in total
- Gender
- Age
- Income and education
- The average Tinder profile (persona)
- Ethnicity
- Data & Methodology
Top Findings
- Tinder has 81 million active users, while 243 million people have tried the app.
- 27% of adults in the US are actively using Tinder or have done so in the past.
- Tinder users spend on average 530 hours every year on the app (8.3% of total waking hours).
- Less than 50% of Tinder users in Europe identify as male (65% of US Tinder users Identify as male)
- 95.5% of Tinders revenue is generated from male users (9.2 million paying male users)
- The average female on Tinder gets 1003 matches a year (2.75 matches per day).
- Women Swipe right on every 13th profile (8%), while men swipe right to every second profile (46%).
- The average height of men based on their Tinder bio is 6.1 ft. (average US height is 5.9 ft.).
- 20% of Tinder users earn over $100k a year.
- Hispanics are the most likely ethnicity to join Tinder (37% have tried the app at one point – twice as likely as whites).
Usage in total
To set the baseline our research showed some baseline numbers. Before we dive into the specifics these are the up-to-date numbers on Tinder Usage:
- Tinder has 81 million active users.
- Tinder has 19.8 million active users in the US alone (24% of all active users on Tinder).
- 27% of adults in the US are actively using Tinder or have done so in the past.
- Tinder is available in 197 countries and has been downloaded more than 510 million times resulting in over 83 billion matches.
- Tinder had 3.6 million downloads in August 2022 alone.
Gender
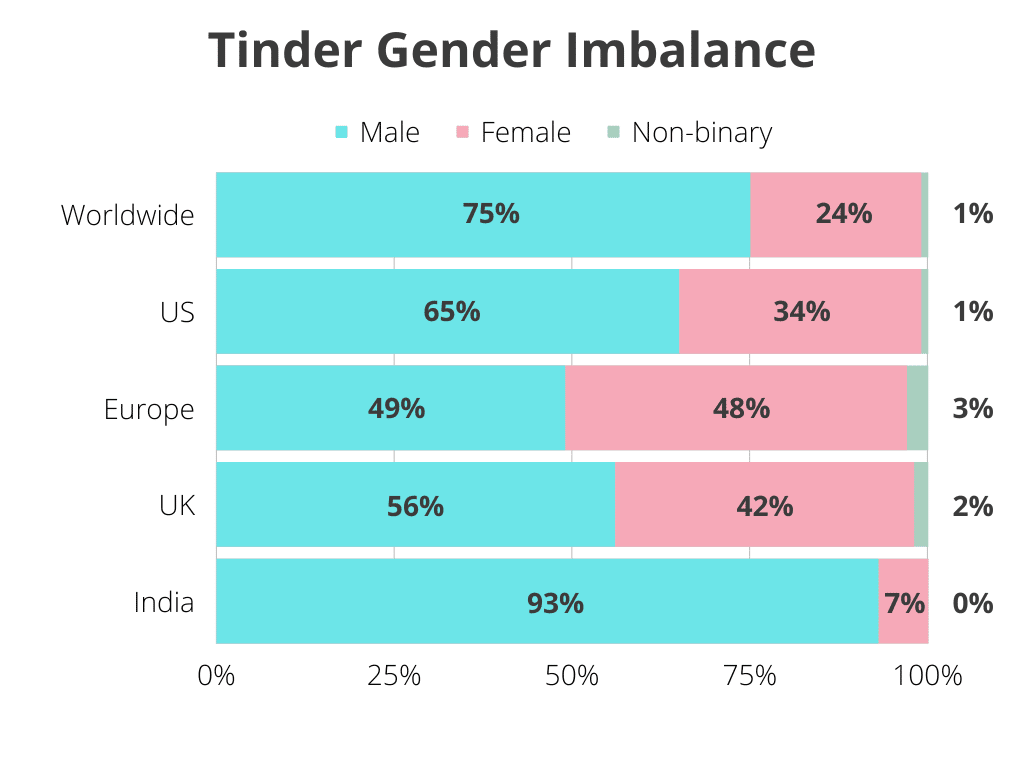
Most people know that both Tinder and other dating apps, often have a gender imbalance.
Depending on which country you look at this imbalance is more or less pronounced.
- One in four people on Tinder is male worldwide.
- Less than 50% of Tinder users in Europe are male (only 49% of Tinder users identify as male in Europe).
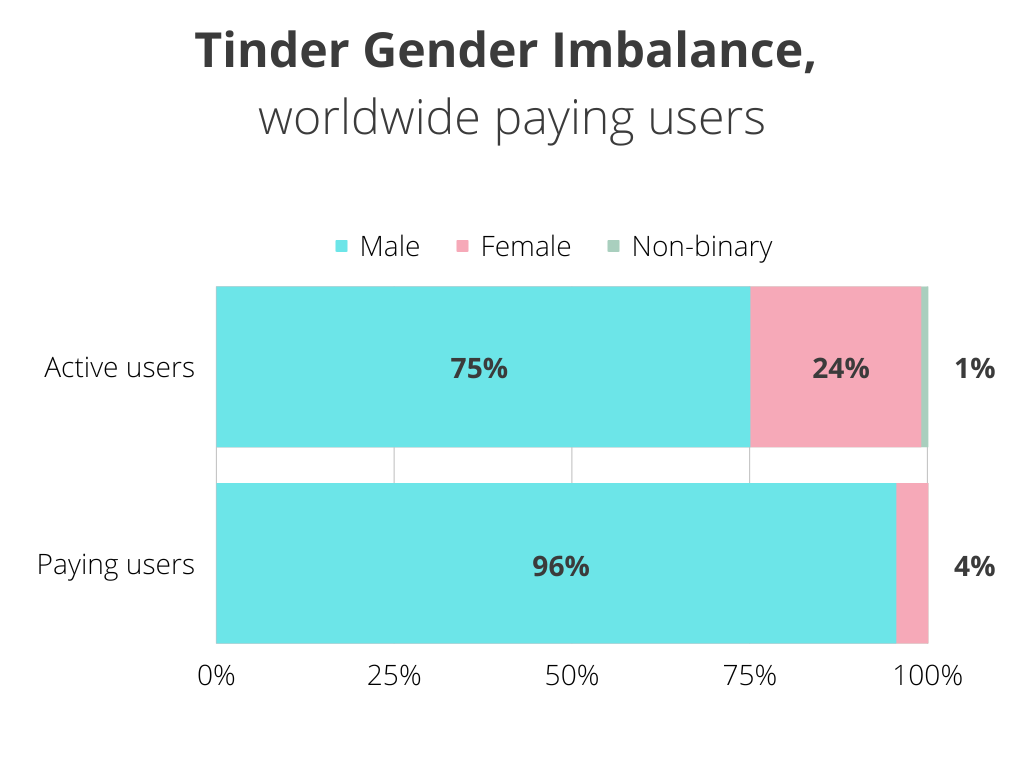
An even more interesting perspective is not just that the data shows a gender imbalance across most regional areas for Tinder, but especially the gender gap when looking at paying users.
Gender Gap in Paying Users on Tinder
Our analysis showed that men are 22 times more likely to pay for Tinder.
Tinder made $1.6 billion in revenue (2021) from 9.6 million paying users.
- Only 4.5% of paying Tinder users are female.
- 95.5% of Tinder’s revenue is generated from male users (9.2 million paying male users).
Maybe it has something to do with the fact, that the number of matches a male user can expect to get on Tinder is much lower than for female users.
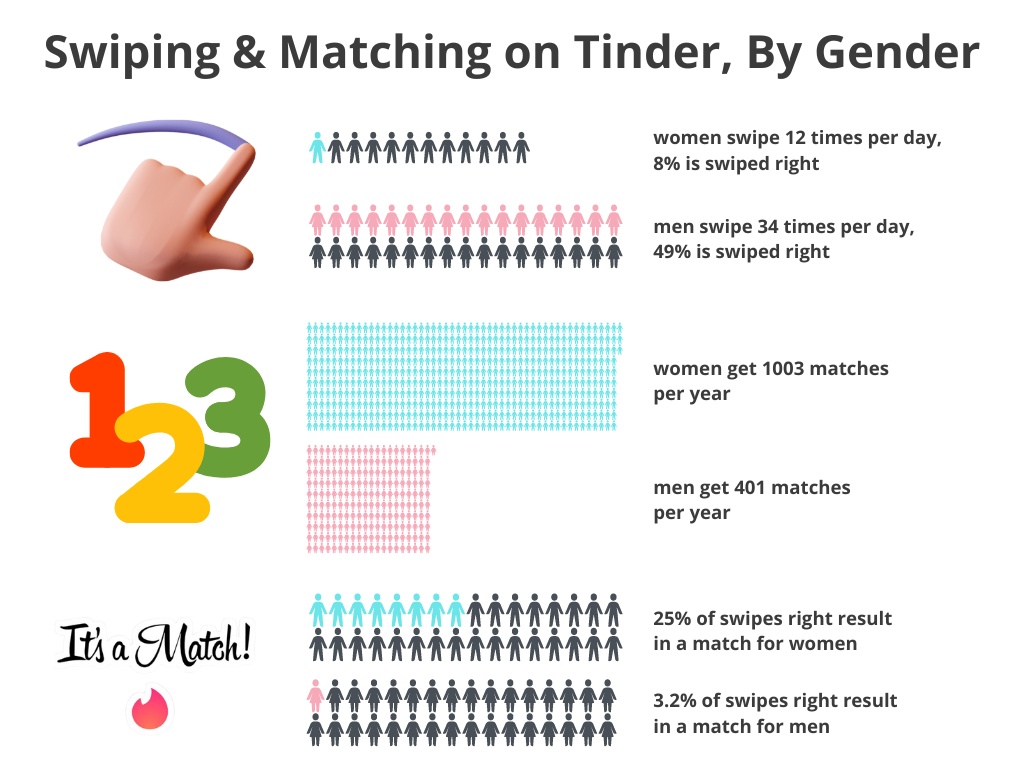
Swiping and Matching on Tinder, by gender
Knowing that 96% of Tinder revenue comes from male users and their subscriptions are tailored for users to get better chances of finding matches, it is no surprise that:
- The average female on Tinder gets 1003 matches a year (2.75 matches per day).
- The average male on Tinder gets just 401 matches in a year (1.1 matches per day).
And that is even though:
- Women swipe right on Tinder on average 8% of the time, every 13th guy*.
- Men swipe right on Tinder to every second girl (46% of the time)*.
Tabulating the above numbers with the average number of swipes per gender, 34 swipes per day for men, and 12 swipes per day for women means that:
- Women get a match on Tinder for every 4 swipes right (25% success rate).
- Men get a match on Tinder for every 31 swipes right (3.2% success rate).
Time spent on Tinder by gender
The average Tinder user logs into Tinder 11 times a day and spends on average 7 minutes and 50 seconds per day on the app.
This is 1 hour and 30 minutes per day, and 530 hours a year, meaning that of the around 6,000 awake hours per year, the average Tinder user spends 8.3% of their time swiping on the app.
Men
- Men spend on average 7 minutes and 12 seconds per login to Tinder.
- Men log into Tinder on average 12 times a day.
- Men spend on average 1 hour and 33 minutes on Tinder per day.
- In a year the average man will have spent 548 hours on Tinder.
Women
- Women spend an average of 8 minutes and 30 seconds per login to Tinder.
- Women log into Tinder on average 10 times a day.
- Women spend on average 1 hour and 25 minutes on Tinder per day.
- In a year the average woman on Tinder will have spent 517 hours swiping.
Tinder fun facts revolving around gender
- Male profiles on Tinder are 21% more likely to be fake compared to female profiles.
- Men meet with 2 out of every 100 matches, women meet with 1.7% of matches.
- Women are more likely to mention tattoos, hair, and piercings in their Tinder bio compared to men.
- Men are more likely to mention jobs, athleticism, and ambition in their Tinder bio compared to women.
- Men are 83% more likely to mention height in their Tinder bio compared to women.
- The average height of men based on their Tinder bio is 6.1 ft., while the average US height is 5.9 ft. for men.
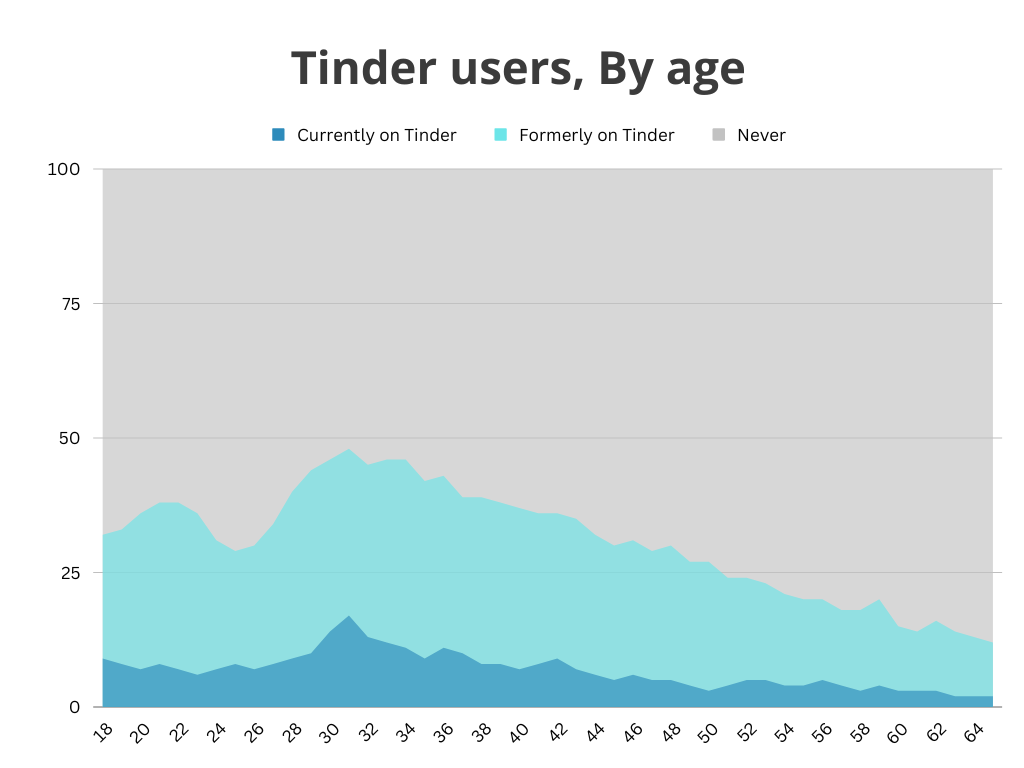
Age
Looking at how Tinder appeals to different age groups surprised us, as we thought this was a youthful app that knew how to cater to 20-year-olds and younger. However, the data showed us something different:
- Tinder is most popular among 30-44 year olds
- 10% of 30-44 year olds are currently on Tinder and 30% have used it previously.
| Age | Yes, I am currently using Tinder | Yes, I have used Tinder in the past but am not currently using one now | No, I have never used Tinder | Total N |
|---|---|---|---|---|
| Total: | 6% (131) | 21% (471) | 73% (1598) | 2,200 |
| 18-29 | 8% (41) | 28% (135) | 64% (311) | 487 |
| 30-44 | 10% (54) | 30% (156) | 60% (315) | 525 |
| 45-54 | 4% (13) | 19% (66) | 78% (275) | 354 |
| 55-64 | 4% (14) | 17% (69) | 79% (313) | 397 |
| 65+ | 2% (8) | 10% (45) | 88% (383) | 436 |
Generations
If we choose to split age groups into another type of age-determined demographic – Generations – the same picture presents itself to us through the data:
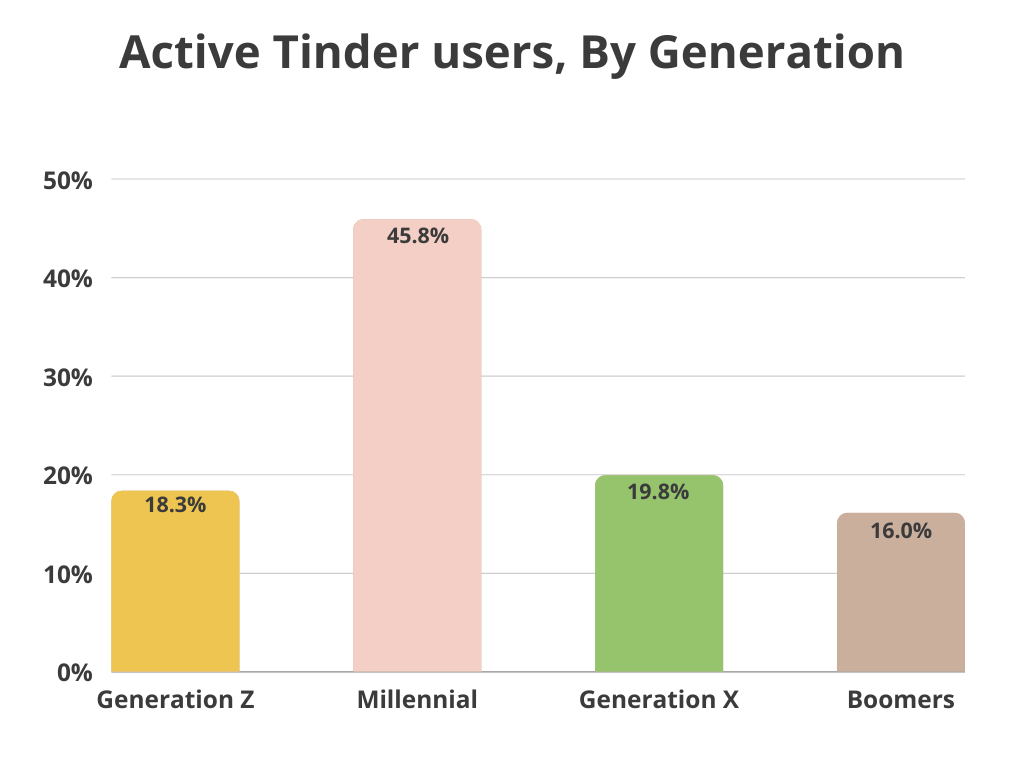
- Millennials are the most active users of Tinder.
- 40% of Millenials are currently using, or have previously used Tinder.
- 46% of users on Tinder are millennials.
| Generation | Yes, I am currently using Tinder | Yes, I have used Tinder in the past but am not currently using one now | No, I have never used Tinder | Total N |
|---|---|---|---|---|
| Generation Z: Age 18-23 | 8% (24) | 27% (79) | 65% (188) | 291 |
| Millennial: Age 24-39 | 10% (60) | 30% (169) | 60% (340) | 569 |
| Generation X: Age 40-55 | 5% (26) | 22% (120) | 73% (399) | 546 |
| Boomers: Age 56-74 | 3% (21) | 13% (91) | 84% (581) | 692 |
Tinder facts about age
- The most common age listed on catfishing or fake profiles on Tinder is 36.
- Tinder itself recently turned 10 years old – as it was founded in February 2012 under the name “Matchbox”.
Income and education
Almost 20% of Tinder users earn over $100k a year. Considering the relatively young generation of users this is a surprisingly high amount of users that have a large income.
- 19% of Tinder users earn over $100k a year.
- 26% of Tinder users earn $50k-100k a year.
- 55% of Tinder users earn under $50k a year.
Looking into education we find that:
- 53% of Tinder users don’t have a college degree.
- 28% of Tinder users have a bachelor’s degree
- 19% of Tinder users have a Post-graduate degree.
The average Tinder profile
Bruce M. Davis

- Male.
- White.
- 31 years old and a millennial.
- Live in the US.
- Earn $46,778 a year.
- Doesn’t have a college degree.
- Get 1.1 matches per day.
- Spends 1 hour and 33 minutes on Tinder each day.
- Says he’s 6.1 ft. in his bio, but is 5.9 ft.
- Owns a dog – that he also mentions in his bio.
- Typically talks about previous athletic achievements and his future career.
- Will go out with just 1 out of every 100 matches.
Ethnicity
- 53% of Tinder users are White.
- 23% of Tinder users are Hispanic.
- 15% of Tinder users are African American.
- 9% of Tinder users belong to other ethnic groups.
Hispanics are the most likely ethnicity to join Tinder.
Here are the percentages of each ethnic group who are currently on Tinder in the population:
- 5% of Whites are on Tinder.
- 11% of Hispanics are on Tinder.
- 9% of African Americans are on Tinder.
- 8% of other ethnic groups are on Tinder.
Data & Methodology
Apart from collecting records on user data and demographics from Tinder, we also collected survey data on a representative sample of 2,200 Americans. In an attempt to transparently present the dataset we have chosen to tabulate it in the following table:
| Demographic | Yes, I am currently using Tinder | Yes, I have used Tinder in the past but am not currently using one now | No, I have never used Tinder | Total N |
|---|---|---|---|---|
| All | 6% (131) | 21% (471) | 73% (1598) | 2200 |
| Gender: Male | 9% (92) | 23% (240) | 69% (730) | 1062 |
| Gender: Female | 3% (39) | 20% (232) | 76% (867) | 1138 |
| Age: 18-29 | 8% (41) | 28% (135) | 64% (311) | 487 |
| Age: 30-44 | 10% (54) | 30% (156) | 60% (315) | 525 |
| Age: 45-54 | 4% (13) | 19% (66) | 78% (275) | 354 |
| Age: 55-64 | 4% (14) | 17% (69) | 79% (313) | 397 |
| Age: 65+ | 2% (8) | 10% (45) | 88% (383) | 436 |
| Generation Z: Age 18-23 | 8% (24) | 27% (79) | 65% (188) | 291 |
| Millennial: Age 24-39 | 10% (60) | 30% (169) | 60% (340) | 569 |
| Generation X: Age 40-55 | 5% (26) | 22% (120) | 73% (399) | 546 |
| Boomers: Age 56-74 | 3% (21) | 13% (91) | 84% (581) | 692 |
| PID: Dem (no lean) | 7% (57) | 21% (176) | 72% (590) | 823 |
| PID: Ind (no lean) | 4% (25) | 22% (141) | 74% (467) | 634 |
| PID: Rep (no lean) | 7% (49) | 21% (154) | 73% (540) | 743 |
| PID/Gender: Dem Men | 10% (39) | 24% (94) | 65% (249) | 382 |
| PID/Gender: Dem Women | 4% (17) | 19% (82) | 77% (341) | 441 |
| PID/Gender: Ind Men | 6% (17) | 22% (68) | 72% (222) | 306 |
| PID/Gender: Ind Women | 3% (8) | 22% (74) | 75% (246) | 327 |
| PID/Gender: Rep Men | 10% (36) | 21% (78) | 69% (259) | 373 |
| PID/Gender: Rep Women | 4% (13) | 20% (76) | 76% (281) | 370 |
| Ideo: Liberal (1-3) | 11% (67) | 24% (156) | 65% (414) | 637 |
| Ideo: Moderate (4) | 2% (14) | 18% (100) | 80% (457) | 571 |
| Ideo: Conservative (5-7) | 6% (46) | 22% (169) | 71% (537) | 752 |
| Educ: < College | 5% (69) | 20% (297) | 76% (1146) | 1512 |
| Educ: Bachelors degree | 8% (37) | 25% (111) | 67% (296) | 444 |
| Educ: Post-grad | 10% (25) | 26% (64) | 64% (155) | 244 |
| Income: Under 50k | 6% (71) | 22% (264) | 72% (857) | 1192 |
| Income: 50k-100k | 5% (34) | 22% (157) | 73% (517) | 709 |
| Income: 100k+ | 8% (25) | 17% (50) | 75% (223) | 299 |
| Ethnicity: White | 5% (90) | 21% (361) | 74% (1271) | 1722 |
| Ethnicity: Hispanic | 11% (40) | 25% (88) | 64% (222) | 349 |
| Ethnicity: Afr. Am. | 9% (25) | 23% (62) | 68% (187) | 274 |
| Ethnicity: Other | 8% (16) | 23% (48) | 69% (140) | 204 |
| All Christian | 6% (64) | 19% (197) | 74% (755) | 1016 |
| All Non-Christian | 14% (16) | 31% (37) | 55% (65) | 118 |
| Atheist | 9% (10) | 22% (25) | 68% (74) | 109 |
| Agnostic/Nothing in particular | 4% (40) | 22% (213) | 74% (704) | 957 |
| Religious Non-Protestant/Catholic | 12% (19) | 32% (48) | 56% (85) | 151 |
| Evangelical | 5% (28) | 23% (134) | 72% (420) | 583 |
| Non-Evangelical | 6% (42) | 18% (135) | 77% (582) | 759 |
| Community: Urban | 8% (51) | 27% (166) | 65% (409) | 626 |
| Community: Suburban | 5% (49) | 21% (211) | 74% (747) | 1007 |
| Community: Rural | 5% (31) | 17% (93) | 78% (442) | 566 |
| Employ: Private sector | 8% (51) | 24% (158) | 68% (438) | 648 |
| Employ: Government | 12% (11) | 32% (31) | 56% (55) | 98 |
| Employ: Self-Employment | 3% (5) | 28% (44) | 68% (106) | 155 |
| Employ: Homemaker | 2% (3) | 12% (18) | 87% (134) | 155 |
| Employ: Retired | 2% (12) | 12% (59) | 86% (438) | 509 |
| Employ: Unemployed | 8% (24) | 23% (68) | 68% (199) | 291 |
| Employ: Other | 8% (16) | 25% (51) | 66% (133) | 200 |
| Military HH: Yes | 8% (27) | 20% (68) | 72% (248) | 343 |
| Military HH: No | 6% (104) | 22% (403) | 73% (1350) | 1857 |
| RD/WT: Right Direction | 8% (61) | 21% (165) | 72% (570) | 796 |
| RD/WT: Wrong Track | 5% (70) | 22% (306) | 73% (1028) | 1404 |
| Sports Fan | 6% (87) | 22% (316) | 72% (1049) | 1452 |
Want to find more dating reports?
Then the below statistics might be the ones for you: