![The State of Sex Toys [+100 Industry Statistics]](https://wp.bedbible.com/wp-content/uploads/2022/03/state-of-the-sex-toy-industry-statistics.jpg)
Delve into an in-depth exploration of the sex toy industry, as presented by the Bedbible Research Center.
This comprehensive report uncovers the evolving trends and attitudes towards sex toys, backed by longitudinal data from 2017 to 2023 and insights from +30,000 respondents.
This study offers a unique glimpse into the current state of the sex toy market, public perceptions, and usage patterns. From market valuations to individual preferences, this report is a treasure trove of information for anyone curious about the world of adult toys.
You may use material from this report as long as you refer to this original report. For special requests, or questions, email researchcenter@bedbible.com.
Key findings
- The Global sex toy market is worth $40.6 billion in 2023.
- The US Market is worth $15.6 billion in 2023.
- In 2030 the Global sex toy market is expected to be worth $80.7B and the US market is expected to be worth $55B.
- 13% is the CAGR (Compound Annual Growth Rate) of the sex toy industry.
- 78% of Americans own a sex toy as of 2023, which has increased from 65% in 2017.
- 50% of Americans use sex toys weekly.
- 82% of women own at least one sex toy.
- Vibrators are the leading sex toys among women.
- 75% of men own at least one sex toy.
- Anal toys are the leading sex toys among men.
- Most sex toy sales are for female products.
- 69% of women aged 18-60 have a vibrator.
- 39% prefer to use sex toys alone rather than with a partner.
- Europeans buy more sex toys than Americans.
- LGBT individuals spend 13.4% more on sex products each year compared to straight people.
- Ownership of anal toys has 3x in 6 years, jumping from 16% in 2017 to 46% in 2023.
- 73% agree that sex toys are taboo in society — a 10% increase in the last 6 years.
- 70% of the US population buys their sex toys online. Only 31% buy it from a physical store.
- Lovehoney is the most popular shop for Americans to buy their sex toys (Brand awareness increased by 66% from 2017 to 2023)
- AdamEve is the biggest loser from 2017 to 2023. They are losing market shares to primarily Lovehoney and then brands such as Lelo and Fleshlight.
- 40% of Americans have spent $100 or more on sex toys in the last 12 months.
- 64% of women own or want to own a Shockwave (clitoral suction) vibrator, highlighting its surge in popularity in recent years.
- Individuals with higher incomes tend to purchase more sex toys.
- Sex toy owners are 20% more likely to report that they are happy in their relationship, and 17% more likely to report they are happy with their sex life.
- There are 8.951 adult stores (brick and mortar) in the US.
- The US states that own the most sex toys per capita:
- Washington DC
- New Hampshire
- Colorado
- The US states that own the least sex toys per capita:
- Mississippi
- South Carolina
- Louisiana
Table of contents
- Market size (world and USA)
- Demographics
- Which sex toys do people own?
- Where do people purchase?
- How much do people spend (microeconomics)?
- How do sex toys impact health and relationships?
- How do people use sex toys?
- Vibrator statistics
- Socioeconomics
- Largest sex toy companies
- Sex toy trends (2017 vs 2023)
- Barriers to entry
- Fun facts
- Sex Toy Interest/demand (all 195 countries analyzed)
Market size (World and USA)
- The sex toy market is projected to grow up to 13% annually (CAGR). This spiked with an unusual increase and a following cool-off period due to COVID-19 in 2020-2021.
- If you laid out the sex toys sold in 2021, you would be able to reach around the world over 8 times!
- The sex toy market doubles every 6th year.
- China and India rank among the world’s quickest-expanding markets for sex toys.
- 70% of all sex toys are produced in China.
- The fusion of technology with novel sex toy designs is leading to the emergence of an industry termed “sex tech.”
- Dildos make up +24% of the worldwide sex toy market.
- The US ranks 4th as the country that purchases the most sex toys per capita.
- Denmark, Sweden, and the US are the countries that search the most on Sex Toys on Google (adjusted for the country’s size). Interested in how many searches your country does pr. 1000 internet users?
- Europeans purchase sex toys more frequently than Americans. This is though expected to be changed around the year 2026 (as you can see from the graph, the US is exponentially increasing from 2026 to 2030).
- There are 7,827 sex toy businesses currently operating in the US (registered companies in this niche).
- More than 40,000 people in the US are employed in the sex toy industry.
- Adult store sales associates earn $13.05 / hr on average in the US.
- There are around 8.951 adult stores in the US. See which one in every state that has the highest rating here.
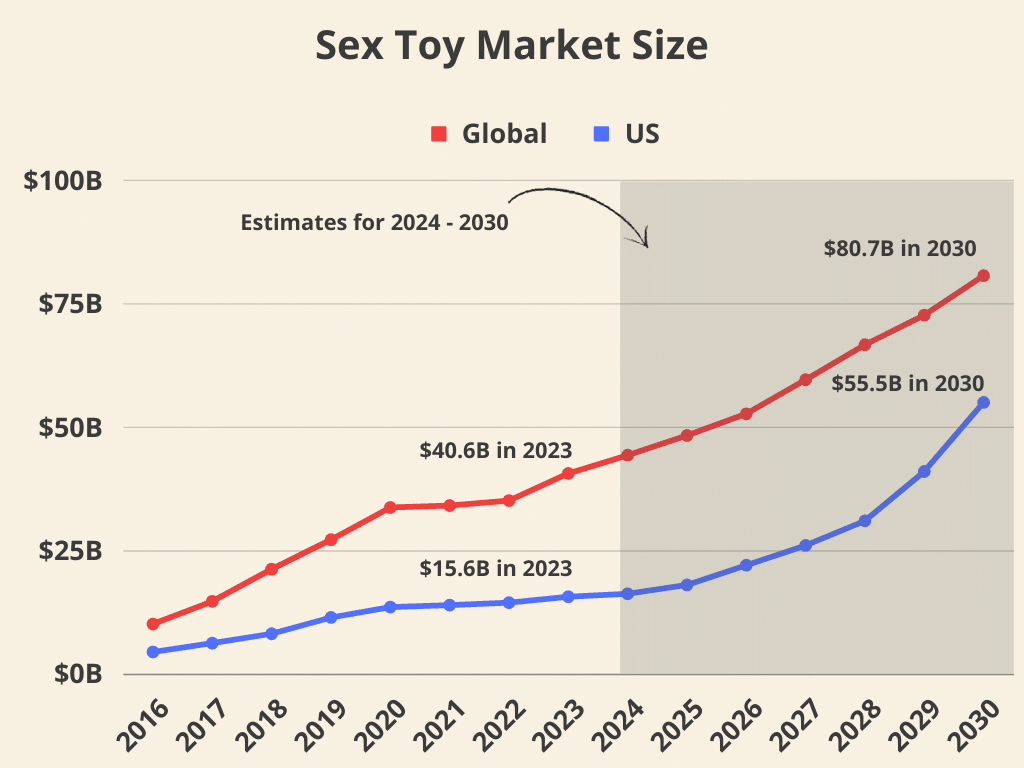
The numbers for the graph above are presented in the table below:
| Year | Global Revenue (in Billions $) | US Revenue (in Billions $) |
|---|---|---|
| 2016 | 10.07 | 4.4 |
| 2017 | 14.67 | 6.2 |
| 2018 | 21.20 | 8.1 |
| 2019 | 27.17 | 11.4 |
| 2020 | 33.70 | 13.5 |
| 2021 | 34.09 | 13.9 |
| 2022 | 35.1 | 14.4 |
| 2023 | 40.6 | 15.6 |
| 2024* | 44.3 | 16.2 |
| 2025* | 48.3 | 18 |
| 2026* | 52.7 | 22.2 |
| 2027* | 59.6 | 26.1 |
| 2028** | 66.7 | 31 |
| 2029** | 72.7 | 41 |
| 2030** | 80.7 | 55.5 |
Sales by US states
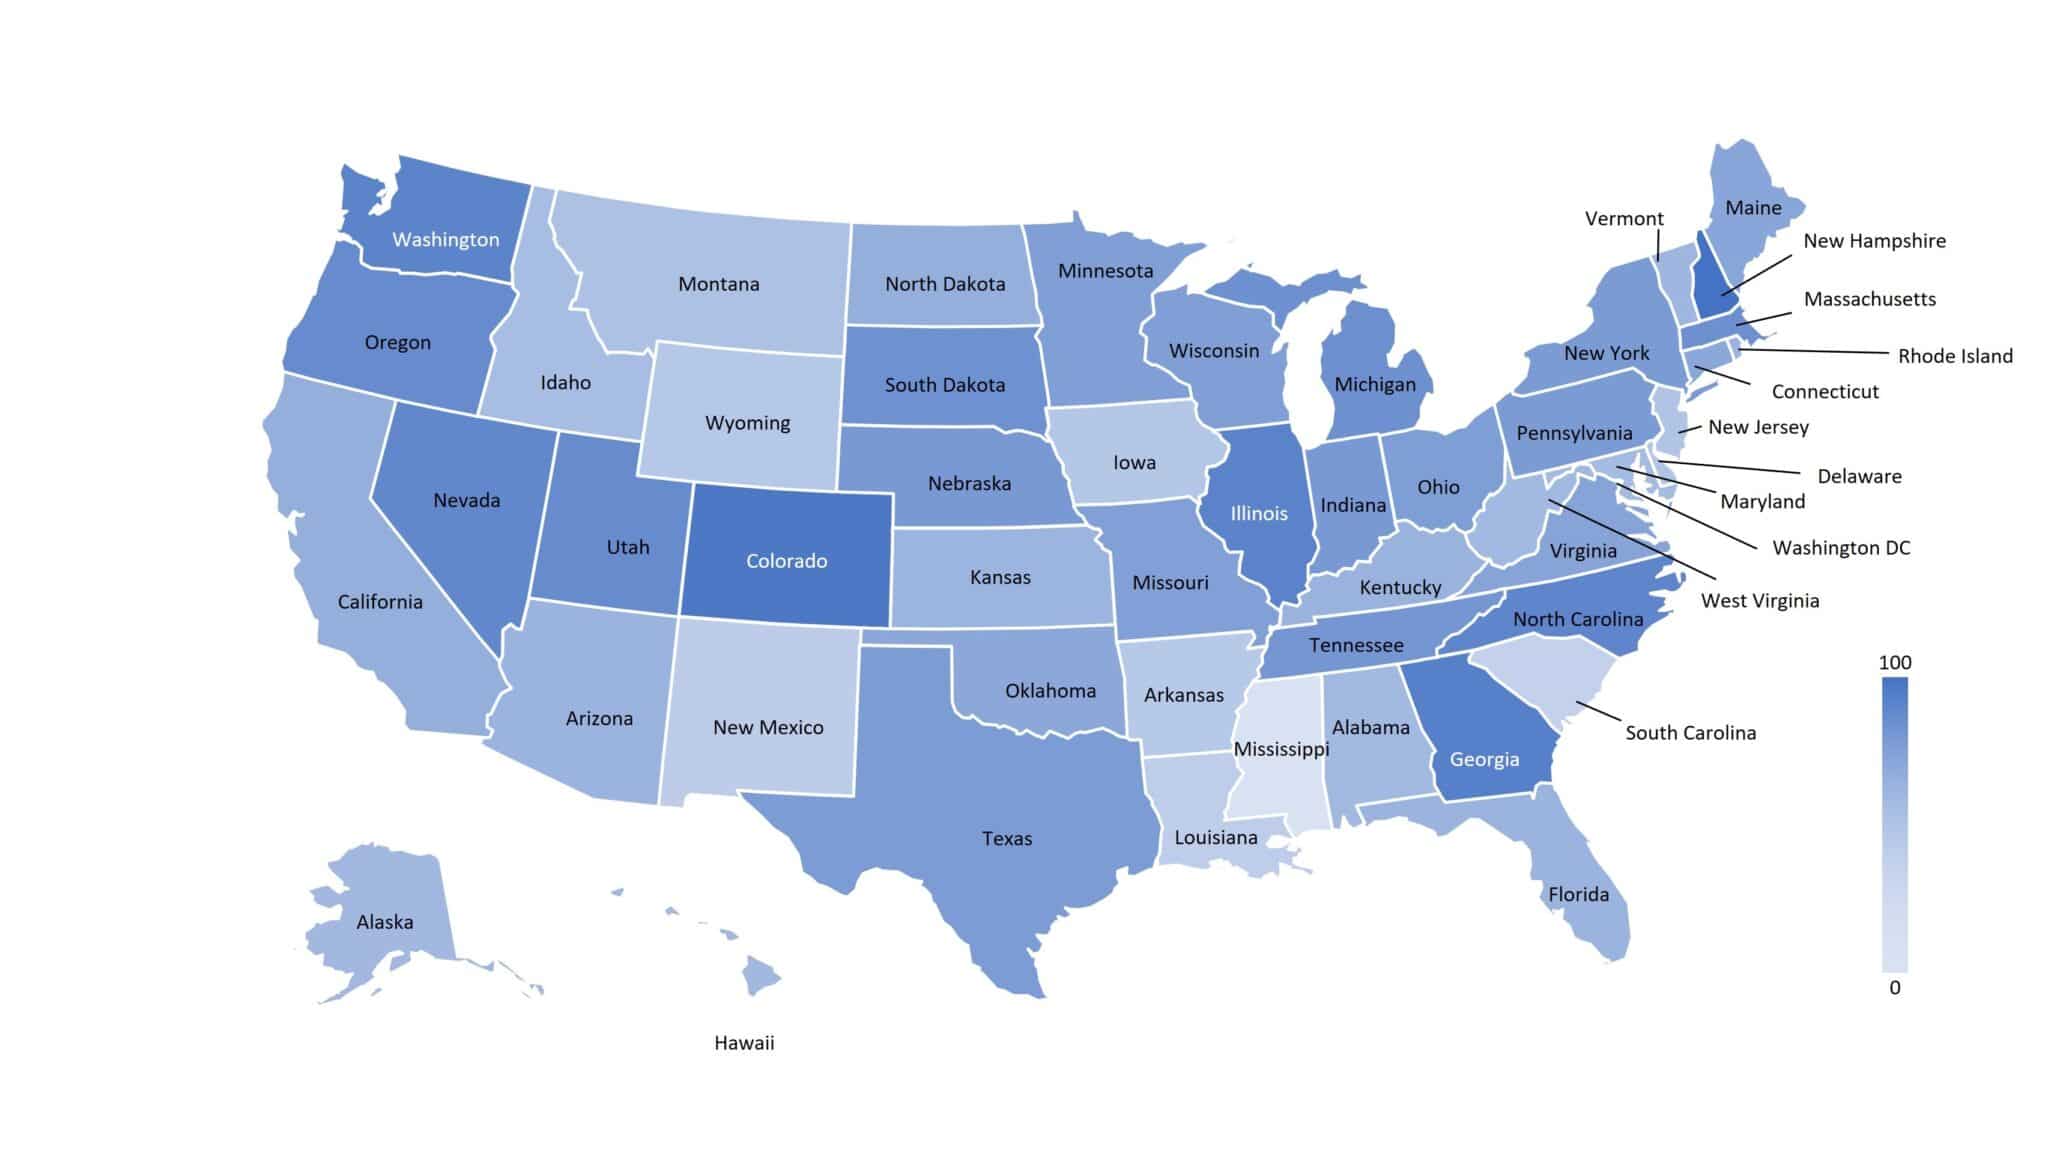
Top 10 states with the MOST sex toy sales
- Washington DC
- New Hampshire
- Colorado
- Georgia
- Illinois
- Washington
- North Carolina
- Nevada
- Utah
- Oregon
Top 10 states with the LEAST sex toy sales
- Mississippi
- South Carolina
- Louisiana
- New Mexico
- Arkansas
- Wyoming
- Iowa
- Delaware
- New Jersey
- Montana
Demographics
- People with non-hetero sexualities are 50% more likely to have used sex toys.
- Sex toys owners are on average 1 year younger than non-owners.
- People in relationships are 15% more likely to have used sex toys.
- 37% of people, who practice their religion more than once a week, own a sex toy.
- People with more education are more likely to own a sex toy.
- People identifying as gay, lesbian, or bi spend 13.4% more annually on sex products than their straight counterparts.
- Female sex toys account for the majority of sex toy sales.
- White, Non-Hispanic people are 22% more likely to own a sex toy compared to Black, Non-Hispanic people
- People who have received oral sex are 10 times more likely to use sex toys
- People who have received anal sex are 4 times more likely also to use sex toys. Find more anal sex statistics here.
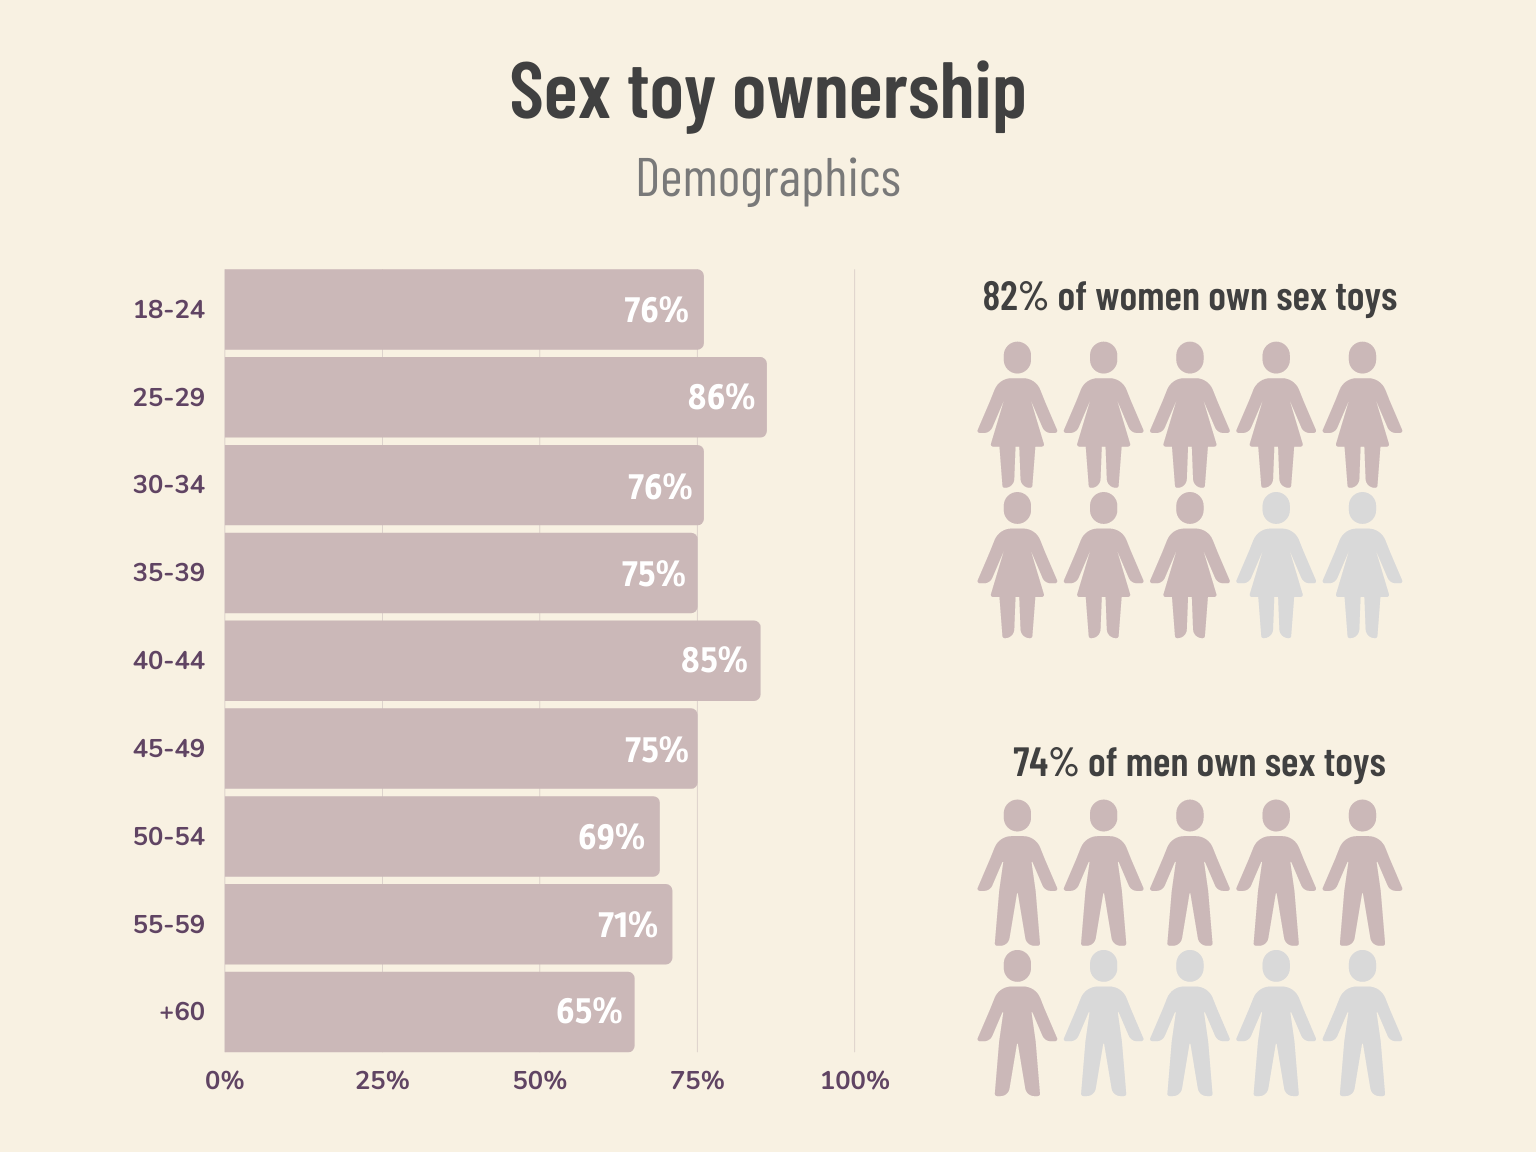
- 78% of all Americans over 18 years old own at least one sex toy
- 82% of women own at least one sex toy
- 75% of men own at least one sex toy
- The younger generations are more likely to buy and own sex toys
Which sex toys do people own?
Vibrators emerge as the clear favorite, boasting an overall ownership of 55%. Interestingly, a significant 69% of females own/use one, in contrast to 54% of their male counterparts.
Anal toys present a unique case, with an even distribution of 46% across both genders. That’s a number that has increased compared to only 16% in 2017.
BDSM equipment, owned by 27% of the respondents, sees a slightly higher inclination among males at 28%, just edging out the 26% of female ownership. Find more fetish-related statistics here.
Dildos, on the other hand, find more favor among females, with 41% ownership over 31% among males. Find more dildo statistics here.
Lubricants maintain a near-equal popularity, with 40% of females and 39% of males owning them. You can read more statistics on personal lubricants in our in-depth statistics on that topic.
Vibrating Love eggs are preferred more by females, with 34% ownership, compared to 25% for males.
The realm of masturbators or sex dolls is predominantly male-dominated with 28% ownership, while only 21% of females own them.
Penis, vagina, or breast pumps show a close distribution with 22% of males and 21% of females owning them.
Cock rings or sleeves are slightly more popular among males at 19%, as opposed to 16% among females.
Concluding the list, strap-ons are owned by 14% of females and a slightly lesser 11% of males.
| Toys | Ownership (in %) | Female Ownership (in %) | Male Ownership (in %) |
|---|---|---|---|
| Anal toys | 46 | 46 | 46 |
| BDSM-equipment | 27 | 26 | 28 |
| Dildo | 35 | 41 | 31 |
| Lubricant | 40 | 40 | 39 |
| Vibrating Love egg(s) | 29 | 34 | 25 |
| Masturbator or sex doll | 25 | 21 | 28 |
| Penis-/vagina-/breast-pump | 22 | 21 | 22 |
| Cock ring or sleeve | 18 | 16 | 19 |
| Strap-on | 12 | 14 | 11 |
| Vibrator | 55 | 69 | 41 |
Based on the data above we can therefore list the 5 most popular sex toys that people have at home:
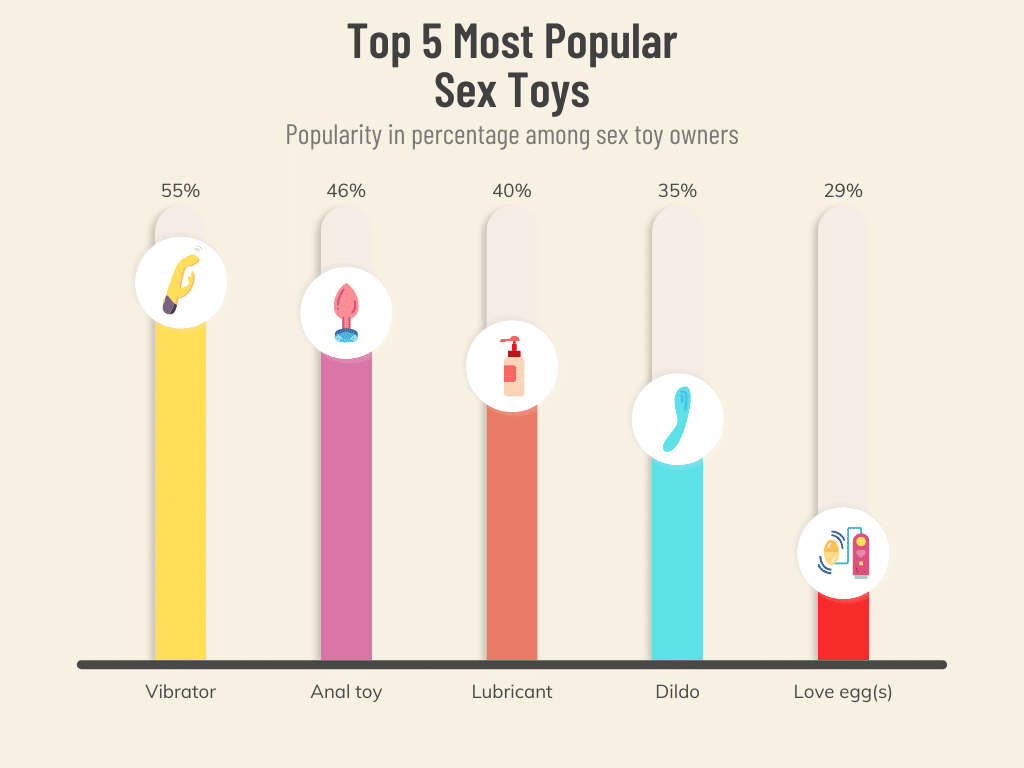
It’s almost the same during sex. We can see that lubricants are popular during sex together with BDSM equipment. The difference between the below graphic and the above is that people here only focus on sex toys used during sex whereas the one above includes solo play.
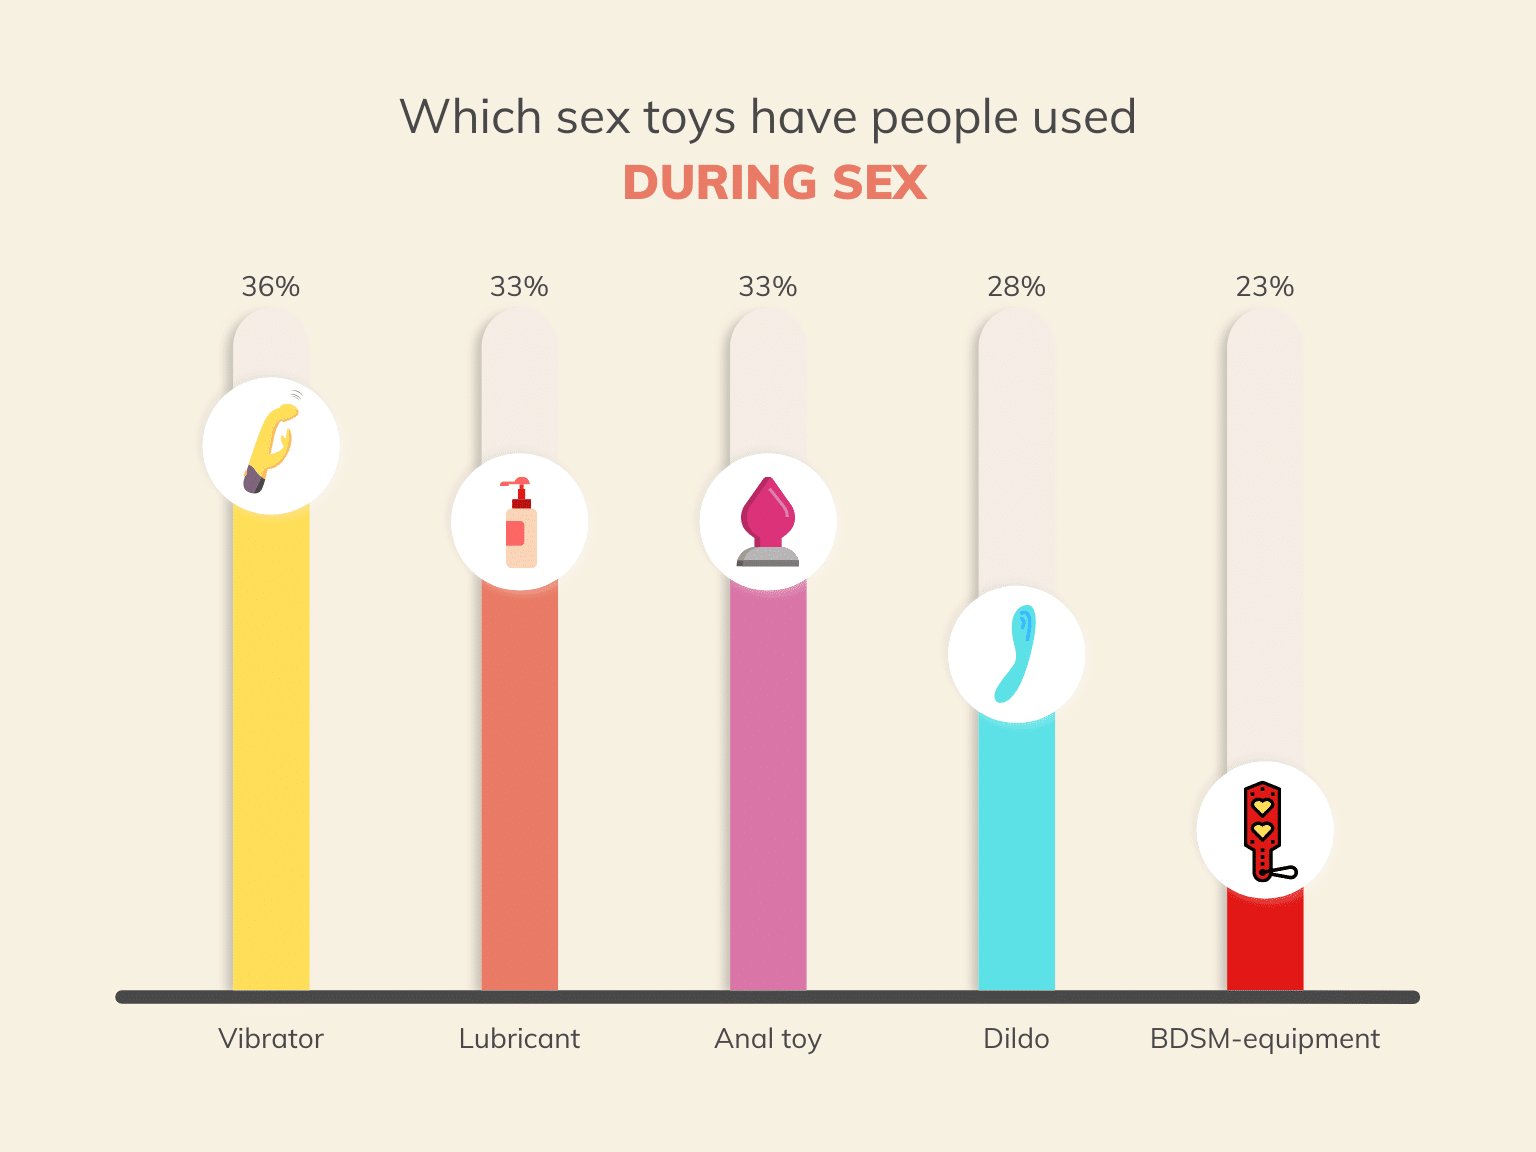
The most bought sex toys
| # | Product Name | Sold pr. mo. (round numbers) |
|---|---|---|
| 1 | Satisfyer pro 2 (Generation 3) | 7100 |
| 2 | Lovense max 2 | 5400 |
| 3 | Magic wand plus | 4100 |
| 4 | Lelo sona | 3800 |
| 5 | Lovense lush 3 | 3700 |
| 6 | Lovense edge | 3300 |
| 7 | Njoy pure wand | 3300 |
| 8 | Fleshlight quickshot | 3200 |
| 9 | Tenga spinner | 3100 |
| 10 | Lovense Solace | 2700 |
| 11 | Lovense Ferri | 2600 |
| 12 | Kiiroo Keon | 2500 |
| 13 | Tenga flip zero | 2300 |
| 14 | We vibe melt | 2200 |
| 15 | Lelo hugo | 2100 |
| 16 | Womanizer Duo | 2100 |
| 17 | Lelo enigma wave | 2000 |
| 18 | Fleshlight riley reid | 1900 |
| 19 | We vibe chorus | 1800 |
| 20 | Fleshlight sky bri | 1800 |
| 21 | Fun factory manta | 1700 |
| 22 | Lovense dolce | 1400 |
| 24 | Lovense domi | 1200 |
| 25 | We vibe tango | 1100 |
| 26 | Womanizer premium | 1100 |
| 27 | We vibe sync | 1100 |
| 28 | Lelo f1s | 1100 |
| 29 | Lovense ridge | 1000 |
| 30 | Lovense calor | 1000 |
Where do people purchase their sex toys?
A significant proportion of the growth in the last 6 years seems to have come from people shopping in pharmacies and drug stores.
One number that surprises a bit might be the fact that 7 out of 10 buy their sex toys online.
| Store | Buy here | Looked here | Not yet | Don’t want to say |
|---|---|---|---|---|
| General store (e.g. Amazon) | 32% (26%) | 41% (18%) | 23% (54%) | 4% (3%) |
| Pharmacy | 24% (6%) | 32% (10%) | 35% (81%) | 10% (3%) |
| Drug store | 21% (7%) | 31% (11%) | 40% (78%) | 8% (3%) |
| A sex shop (online) | 70% (35%) | 36% (19%) | 23% (43%) | 9% (3%) |
| Sex shop (retail) | 31% (46%) | 34% (14%) | 29% (37%) | 6% (3%) |
Which online sex shops do people know and buy from?
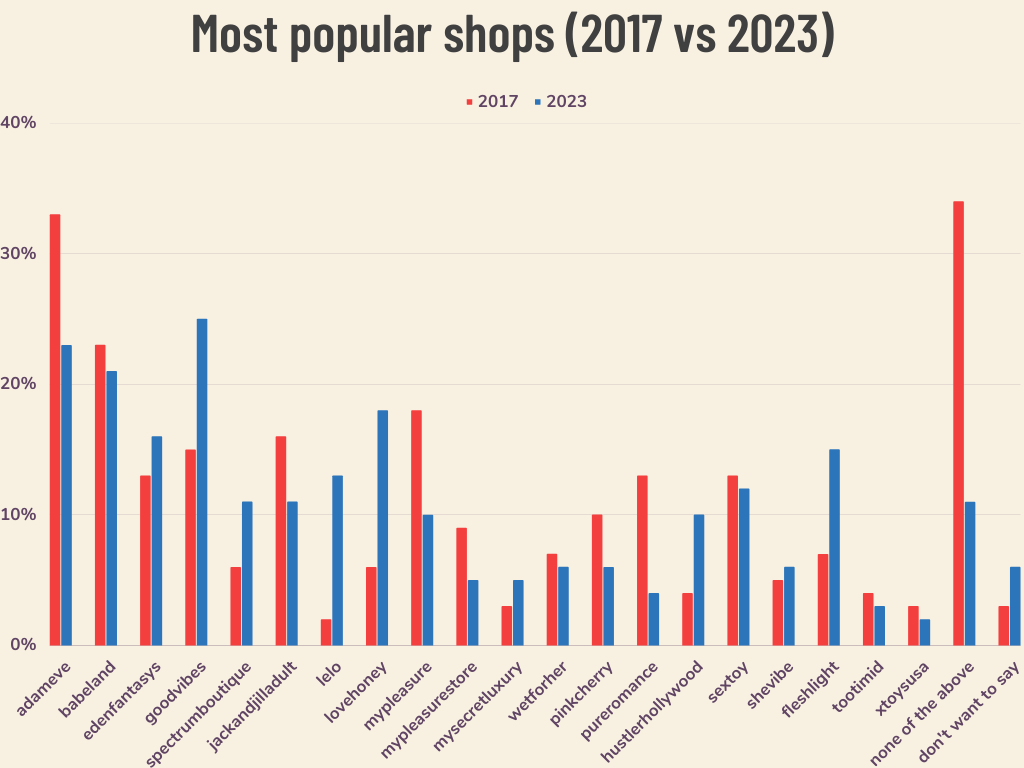
We have below listed the most popular shops/stores and analyzed how they have developed in the last 6 years. We’ve also figured out that 89% of the US population have either bought from or know of at least one specific online sex toy retailer.
- Winners: Lovehoney, HustlerHollywood, and brands like Lelo and Fleshlight have become wildly more popular than they were 6 years ago.
- Loosers: AdamEve, MyPleasure, Jackandjilladult, and Pureromance on the other hand have seen a steep decline in their popularity over the last 6 years.
In line with the other results and the overall image that sex toys have become way more popular, only 11% of the population were not familiar with at least one of the shops above.
In 2017, a whopping 34% didn’t know any of the mentioned shops.
Which online sex shop is the cheapest?
As a review platform with access to order data from over 100 sex toy stores, we’ve analyzed and presented these findings:
- Number of times a shop is cheapest on a product: Our findings indicate that SheVibe.com is the most affordable online sex shop, offering the lowest prices on 65% of products. Lovehoney.com ranks closely behind, being the cheapest for 40% of their stocked products.
- Average product price across all toys: Our research shows that SheVibe.com is the most cost-effective store, with an average saving of $4.12 per product, closely followed by Pinkcherry, which offers an average saving of $3.42.
- Cheapest shipping cost: Lovehoney.com stands out as the most affordable option for shipping. It has the lowest standard shipping rate at only $6.99 and provides free shipping for orders over $49, the smallest minimum order requirement for this benefit.
- Randomness: After placing 13 random sex toy orders with various products, we discovered that Shevibe.com is the most affordable sex toy store.
- Overall: SheVibe is the cheapest webshop since it was the best in 3 out of 4 methods. You can find the whole analysis here.
How much do people spend (microeconomics)?
Here are some statistics on buying behavior and economics related to sex toys. Lastly, we further asked respondents how much they have spent on sex toys in the last 12 months, and the numbers speak for themselves — we spend a lot more now, compared to 6 years ago!
- Men on average spend almost 20% more than women per order.
- Women on average buy smaller sex toys (e.g., slimmer and shorter dildos and plugs).
- The average adult spends $18 on sex toys every year.
- The average cost of a sex toy purchased is $23.
- Men choose to pay extra for faster delivery more often than women (17% more).
- 40% of Americans have spent over $100 in the last 12 months on sex toys, compared to just 24% in 2017.
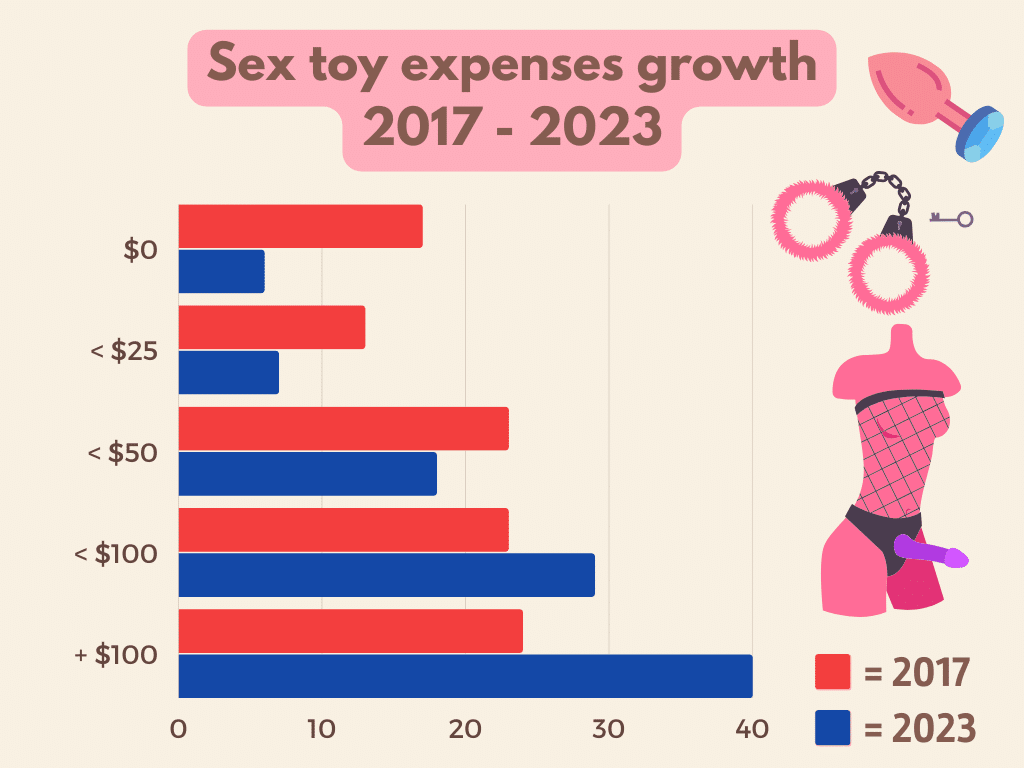
The data is available here:
| Expenses | 2017 | 2023 |
|---|---|---|
| $0 | 17% | 6% |
| < $25 | 13% | 7% |
| < $50 | 23% | 18% |
| < $100 | 23% | 29% |
| + $100 | 24% | 40% |
How do sex toys impact health and relationships?
- Sex toy users are 16% more likely to have visited a gynecologist in the last year.
- Sex toy users report having experienced 8% fewer days with mental distress.
- 10% have successfully used sex toys, such as vibrators, penis pumps, or cock rings, to alleviate a problem in their sex life.
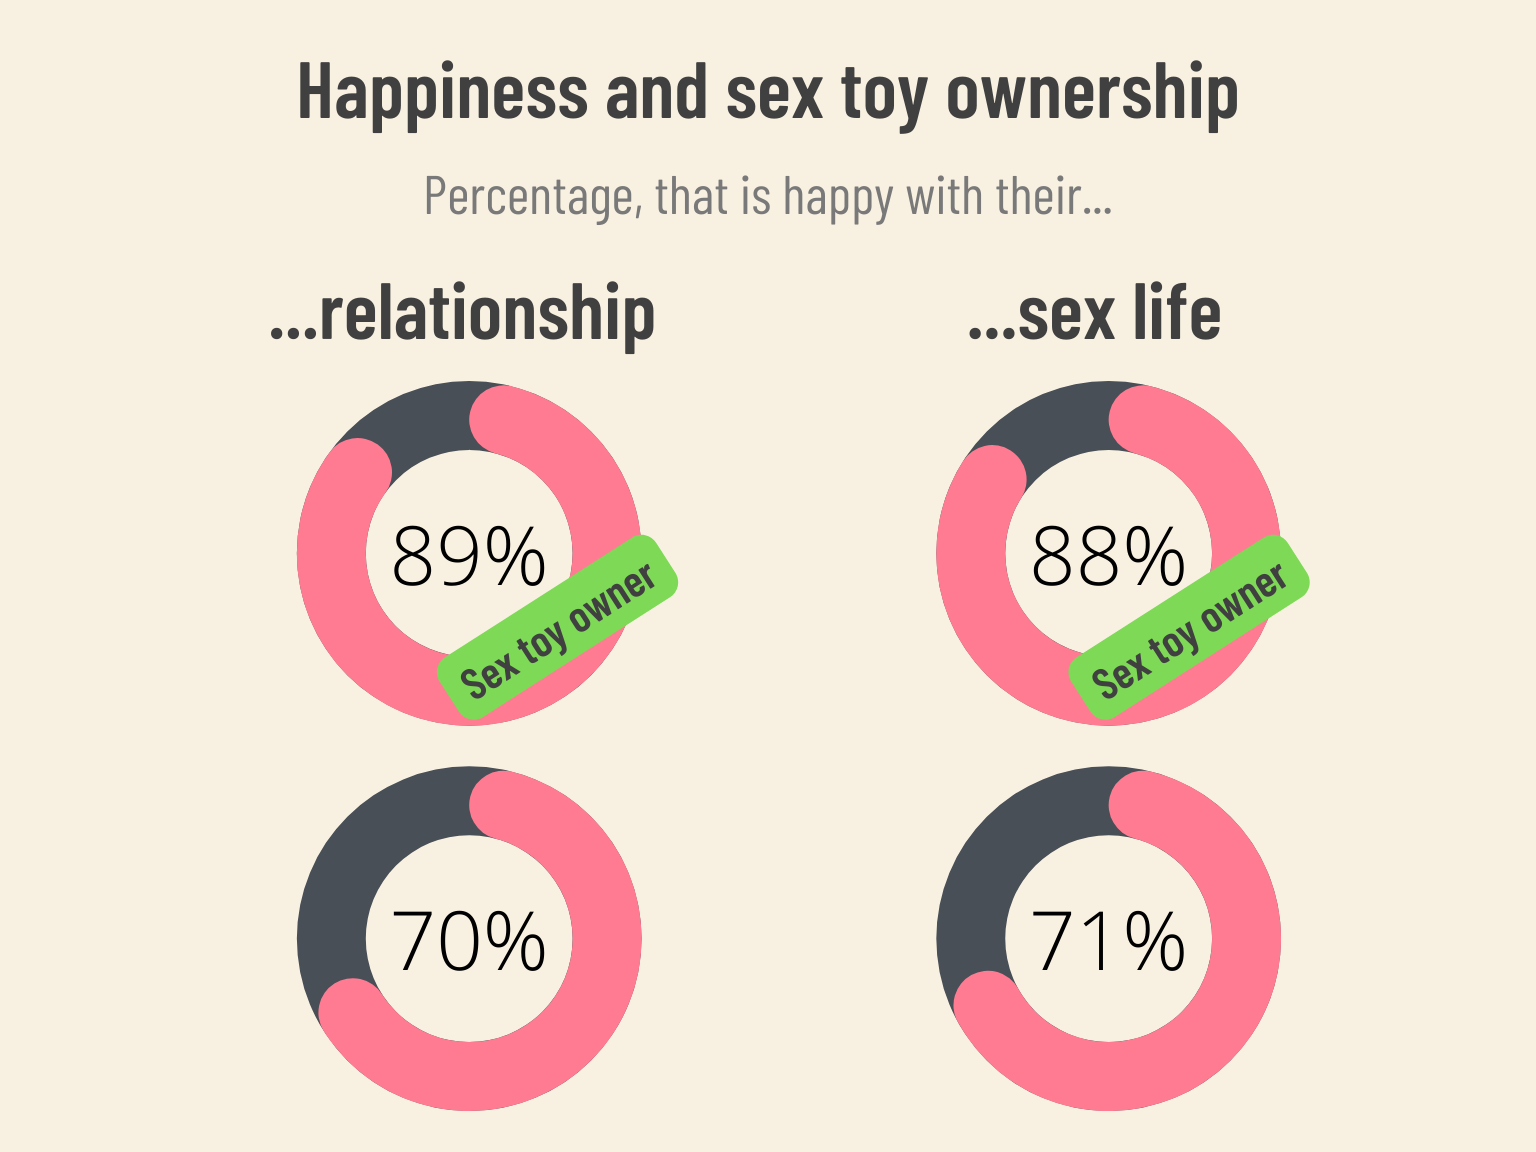
- People who own sex toys are almost 20% more likely to report that they are happy in their relationship.
- Sex toy owners are 17% more likely to report that they are happy with their sex life.
How do people use sex toys?
Have we become more individualistic and egocentric over the last 6 years — also when it comes to sex toys?
- Almost twice as many people would rather use sex toys exclusively alone in 2023 compared to just 6 years ago (16% in 2023 v. 9% in 2017).
- 41% have tried using lubricant with their sex toys.
- Women have tried using sex toys more often during solo sex (53%) compared to men (37%).
- 39% prefer to use a sex toy alone rather than with a partner. In 2017, that number was just 23%.
We asked respondents how they prefer to use a sex toy, and these were the results:
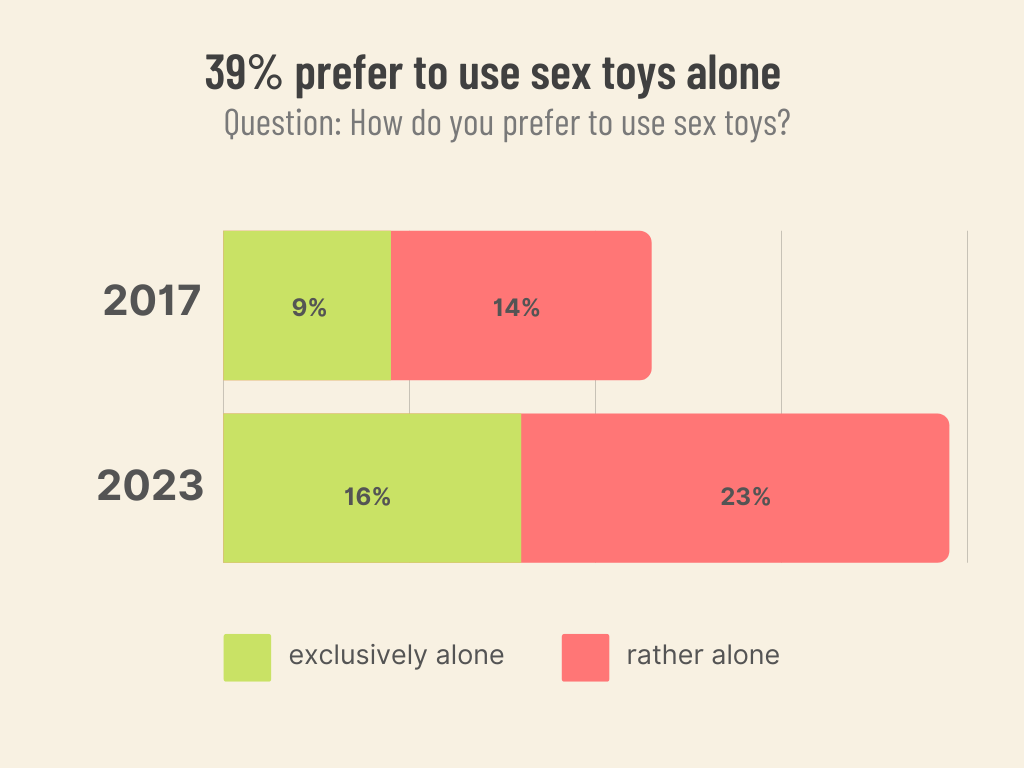
The numbers might suggest it.
While we might be quick to think the preference for using sex toys alone applies more to the younger generations, the data actually shows the opposite:
- 20% of the 51 and overs prefer to use sex toys exclusively alone, whereas only 15% of the 18-35 year olds do.
- 14% of 18-35-year-olds answered that they would rather use sex toys with their partner. Comparatively, only 7% of +51-year-olds answered that they would rather use sex toys with a partner.
We prefer it either-or but not both
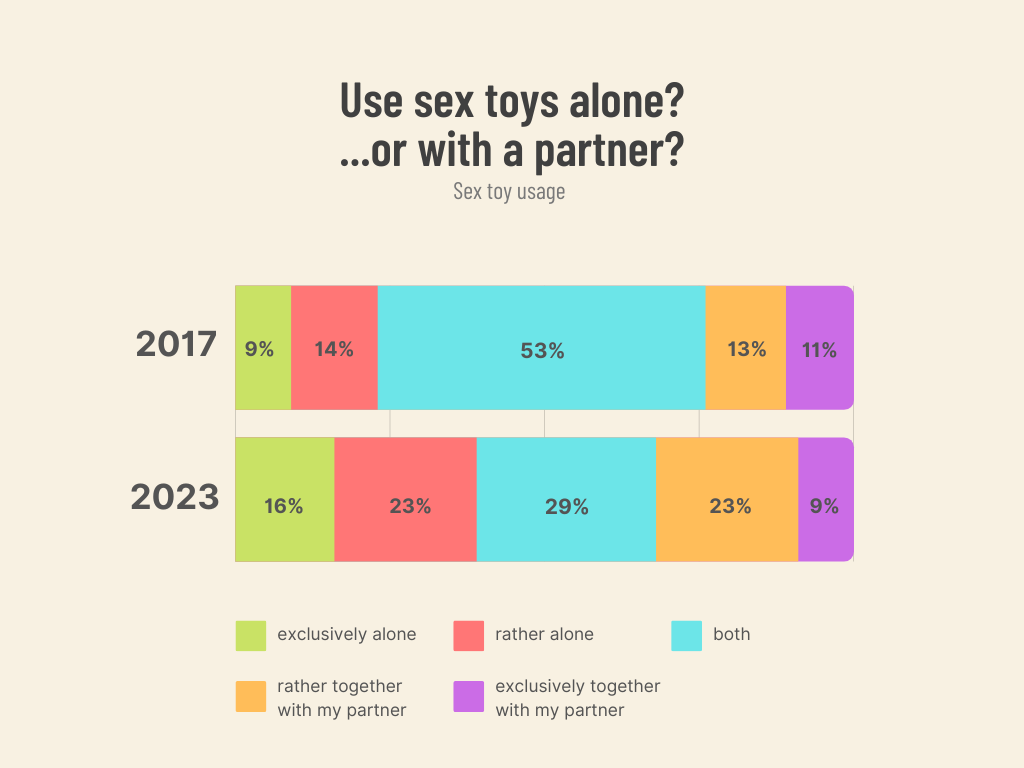
If we look even closer at the data, it’s actually not the case that people use sex toys less with a partner, as we might have initially thought.
It’s just that they don’t do ‘both’ as much as they did previously!
So, even though it’s often proclaimed that society is becoming more individualistic, we are actually also becoming more involved with our partners – at least when it comes to sex toys.
People prefer to use sex toys either alone or with a partner, rather than both – compared to 6 years ago.
Vibrator statistics
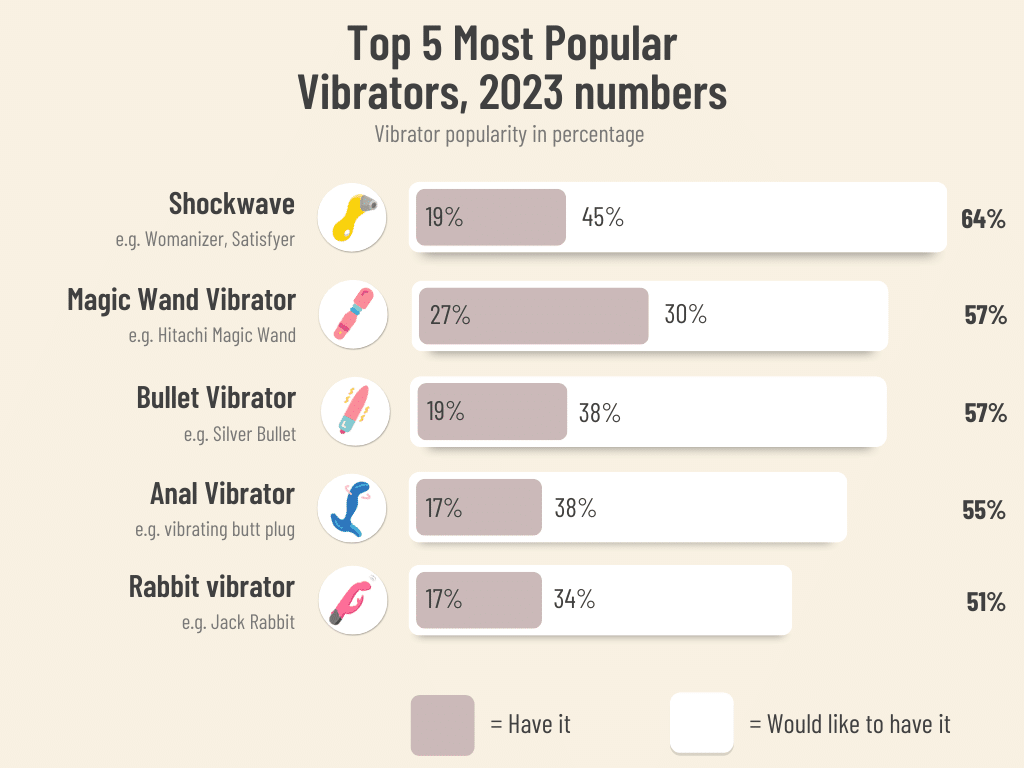
We asked people which vibrators they owned or would like to own.
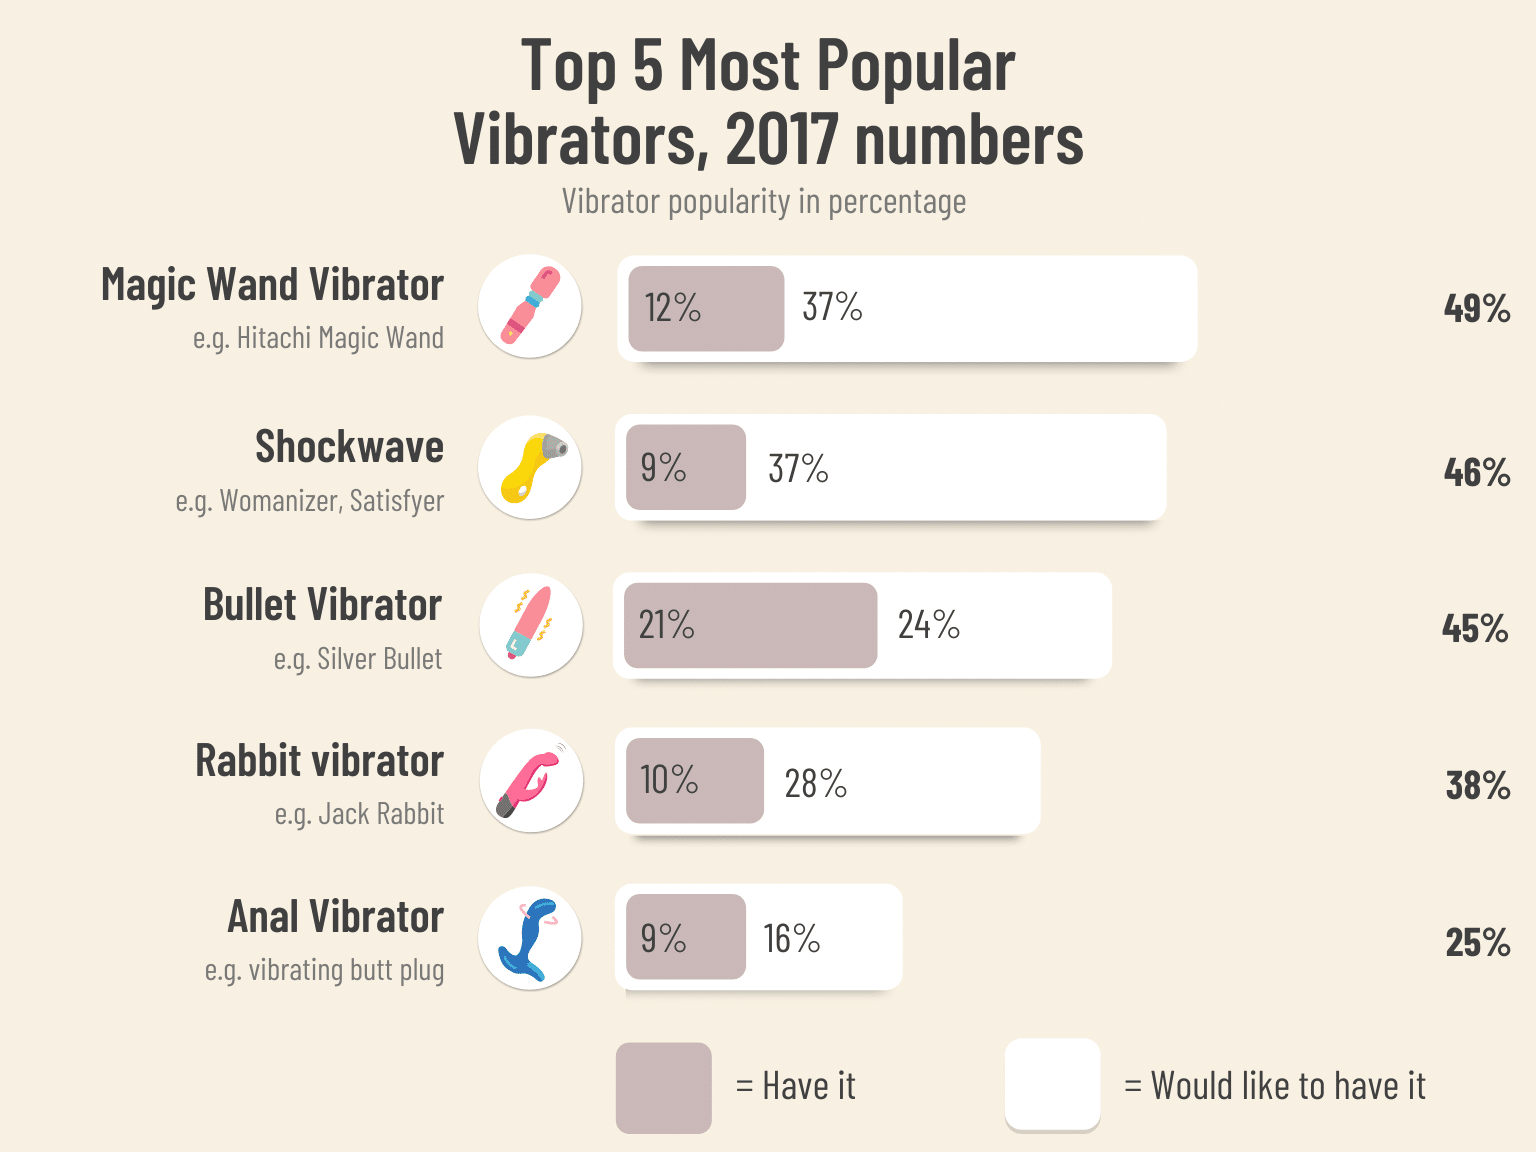
Over the last 6 years, there’s been a big increase in the popularity of shockwave (clitoral suction) vibrators and anal vibrators:
- Ownership of shockwave or suction vibrators grew from just 9% in 2017 to 19% in 2023.
- Ownership of anal vibrators grew from 9% to 17%
- 69% of women aged 18-60 have a vibrator.
As well as the increase in people who now own these two types of toys, the number of people who would like to own them also increased.
- 8% more would like to have a shockwave vibrator, and 22% more would like to have an anal vibrator.
The top 5 most popular vibrator types can be seen below:
For reference, the top 5 vibrators of 2023 are listed below, together with the 2017 numbers:
Other interesting vibrator statistics
Approximately 14% of individuals have never engaged in cleaning their vibrators. Those identifying with non-heterosexual orientations are about 50% more inclined to utilize a vibrator. Around 41% have experimented with the addition of lubricants during vibrator use. Interestingly, 37% of devout individuals who engage in religious practices more than once weekly also report owning a vibrator. A smaller segment, about 7%, have tried using a condom on their vibrator.
In terms of relationship status, those in partnerships report a 15% higher likelihood of vibrator usage. When it comes to receiving vibrators as gifts, 35% of women have had this experience, in contrast to 20% of men. There’s a notable difference in preferences too; women generally opt for smaller, slimmer, and shorter vibrators compared to men.
A significant 18% of people harbor fantasies about vibrator use, yet have never actually tried it. Affluence seems to play a role in vibrator ownership; wealthier individuals are more prone to purchase these devices. This trend is supported by upcoming research that correlates vibrator sales with median household income.
Globally, the United States ranks fourth in per capita vibrator purchases, trailing behind Denmark, Sweden, and Greenland. This data points to a diverse range of practices and preferences in vibrator usage across different demographics and lifestyles. Find these and many more vibrator statistics here.
Socioeconomics
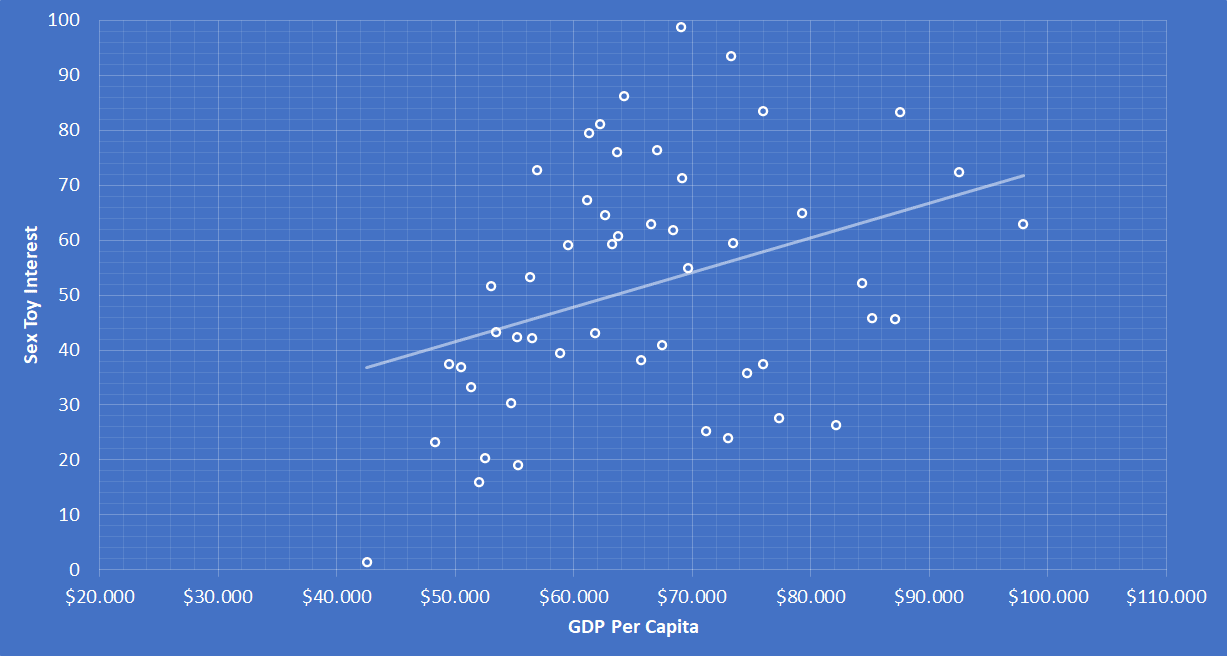
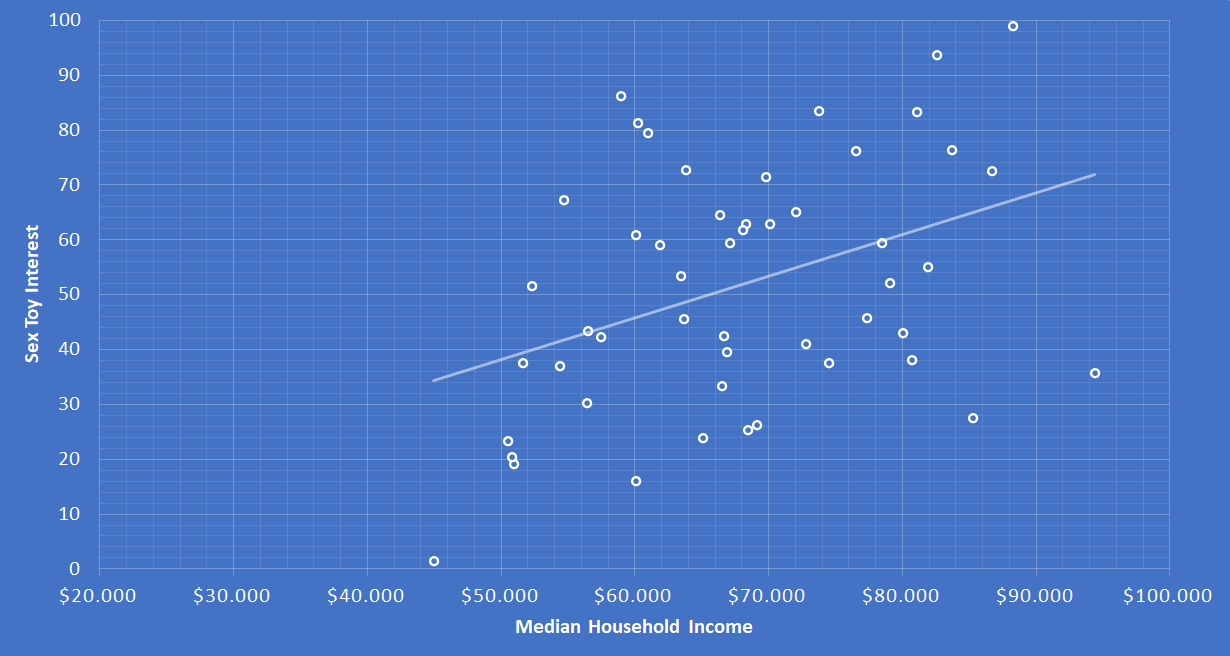
- Richer people buy and own more sex toys
The below data is based on state and city data points.
However, the same results are present in both the 2017 and 2023 surveys. By using a logarithmic regression to predict the likelihood of owning sex toys, it’s apparent that there is a much larger likelihood that richer people own sex toys.
The conclusion is simple: Richer people buy more sex toys.
As for the reason why? We cannot conclude on reasons for this, but some arguments come to mind:
- Richer people have more disposable income, so they can more easily act on any wishes to use sex toys
- Sexual wellness as a form of self-care might be more openly discussed and less taboo among higher earners
Largest sex toy companies in the US
1. Lovehoney Group
In a recent merger, Lovehoney Limited and WOW Tech combined forces, creating ‘Lovehoney Group’ now valued at 1.2 Billion USD with revenues over 400 Mio. USD in 2021. You might have heard of Womanizer or even the Fifty Shades of Grey sex toy collection. All are owned by the giant that is Lovehoney Group. The Lovehoney Group approximates that around 70% of their clientele are in enduring relationships. Lovehoney Group have since it started in 2003 seen about a 35% growth annually.
2. AdamEve
A dominant player in retail, with physical stores in 22 states, as well as Peru and Canada. In a recent acquisition of Excite Group (Australia’s largest online adult store), they proved that 52 years in the industry surely matters and that they also dominate online retail both in the US and internationally.
Sex toy trends (2017 vs 2023)
Here are some of the more interesting observations on the trends:
- The increasing LGBT community and the surge in online shopping are key drivers for the sex toys industry in the upcoming years.
- Creative marketing strategies and celebrity partnerships with sex toy brands are also anticipated to significantly boost the industry’s growth.
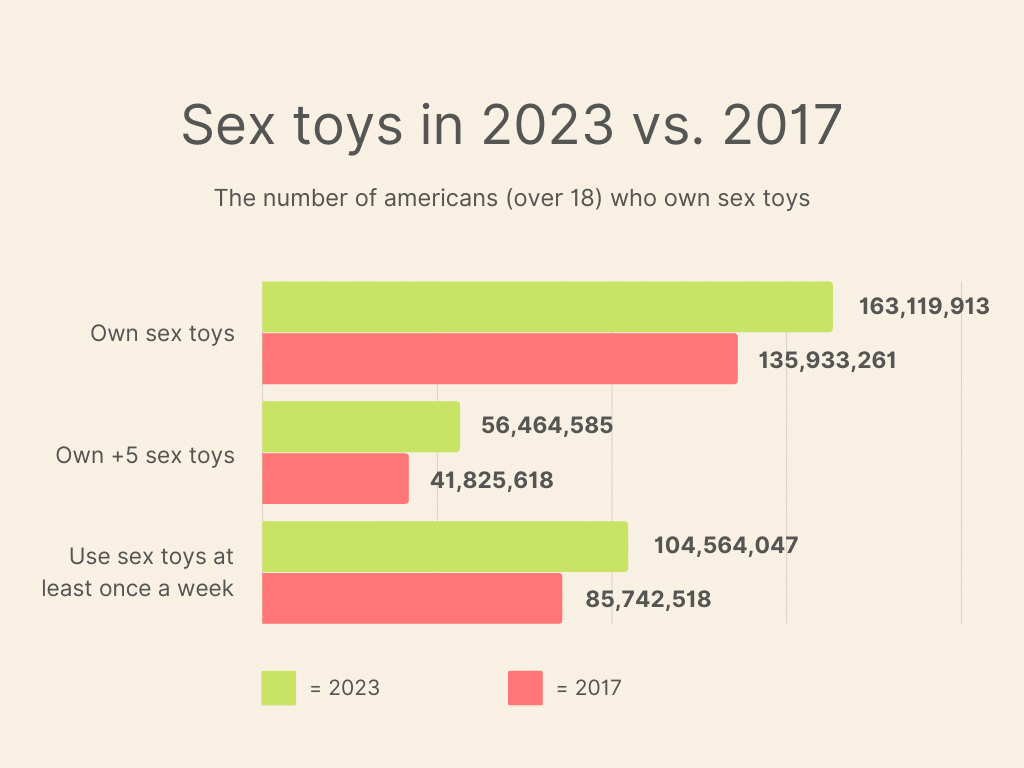
- 13% more people own sex toys (65% in 2017 compared to 78% in 2023)
- Of those, the biggest growth (+17%) is amongst the older generation (51 years and older)
- 27% of respondents own 5 or more sex toys, compared to 20% in 2017 — an increase of 7%.
- We are becoming more kinky in bed. Owning BDSM equipment, such as ropes and whips, is more frequent than ever. 23% have used some form in 2023, whereas only 14% had in 2017.
- Almost 10% use sex toys daily in 2023, compared to just 5% in 2017.
- The younger and older generations, in particular, are avid users of sex toys: 55% of the 18-35-year-olds use sex toys once a week or more, and 51% of the 51 and overs use sex toys at least once a week.
To elaborate on these facts, this means that:
- 56 million Americans own more than 5 sex toys, that is 27% of the whole US population.
- Half of Americans over 18 would have used their sex toys during the last week (51% to be exact).
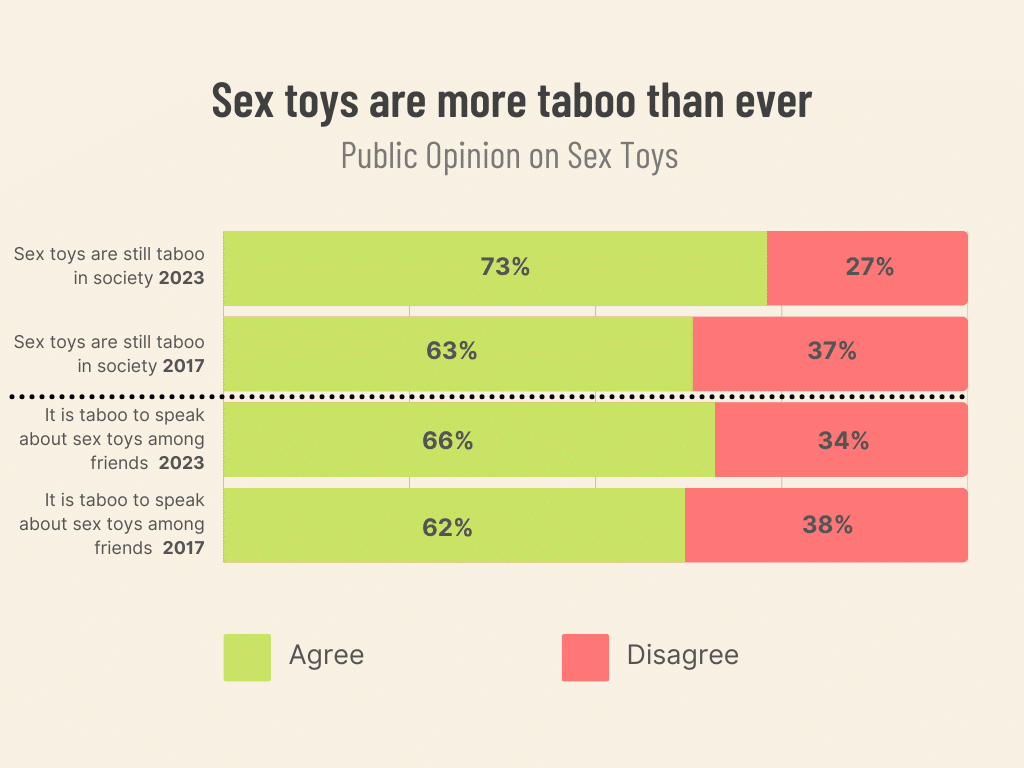
Public opinion on sex toys – “Sex toys are still taboo”
We’ve asked respondents to what extent they agree with statements on the topic of sexuality and sex toys.
Here are their answers.
- Over the past 6 years, there has been an increase of 10% among people who believe that sex toys are still taboo in society today.
- Almost 66% believe that speaking about sex toys among friends is taboo in 2023.
Against all wisdom, the taboo around sex toys has only grown in the past few years. Substantially.
Even though more people than ever own sex toys, we are more afraid to speak about it.
The next popular sex toys
It might seem like we’ve reached the limit with sex toys. Can this market keep expanding? What more do we have to explore?
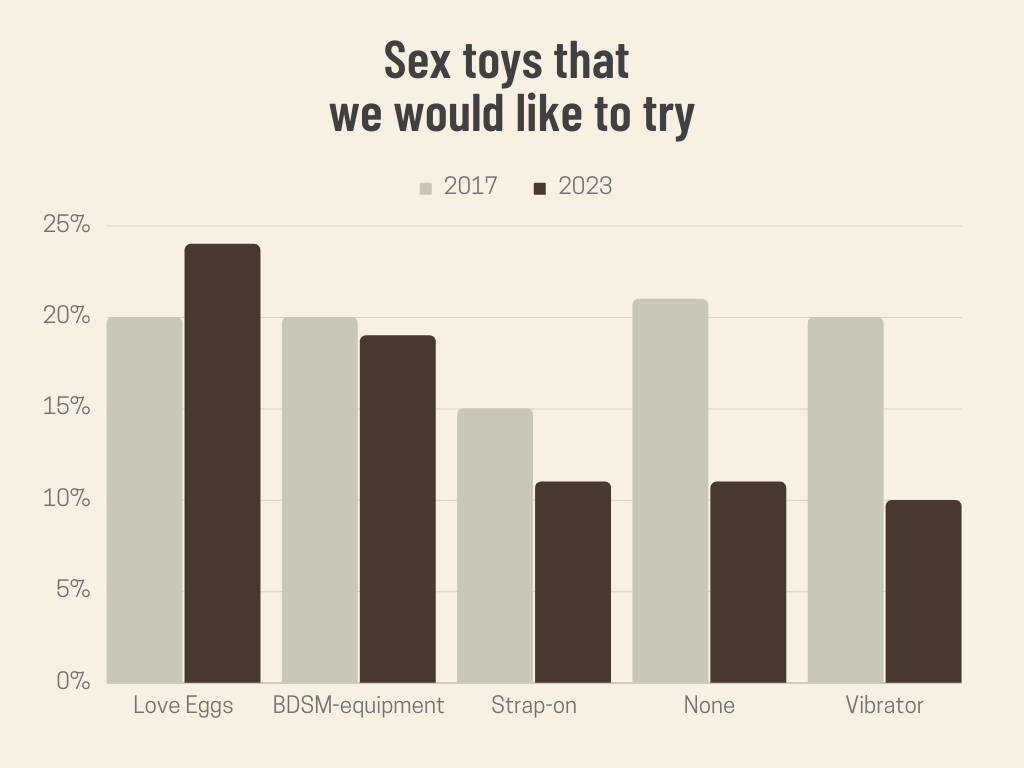
Looking at the answers, it seems there’s still unchartered ground that people want to explore. This is especially exciting for any Love egg manufacturers in the coming years.
- 24% want to try a Love Egg in 2023. That number was just 20% in 2017.
The numbers indicate that during the last 6 years, people have tried more of the things they wanted to try previously.
An obvious question arises, why do so few people want to try vibrators in 2023? Well, the numbers indicate that most already have.
The data also shows that people are getting used to sex toys. To the question “For what reasons do you use sex toys?”
- 11% answered that they use sex toys out of habit in 2023, and only 5% answered the same in 2017.
Barriers to entry
While the industry sees numerous trends and opportunities, the acceptance and use of sex toys remain taboo in many regions.
Key challenges the market faces include:
- Strict laws in countries like Saudi Arabia and the UAE hinder market growth.
- In nations like India, Vietnam, and Malaysia, cultural taboos around sex toys, even if not illegal, limit their acceptance.
- China, producing about 70% of all sex toys, has a significant issue with counterfeit products, potentially harming industry vendors.
- The sex toy industry lacks stringent regulation.
- In the US and Canada, there’s minimal oversight on the manufacture and sale of sex toys. Manufacturers exploit a “novelty item” labeling loophole.
- The US FDA regulates only three vibrators, labeled as therapeutic medical devices.
- The use of phthalates in jelly plastic sex toys is unregulated, posing potential health risks.
- Payment platforms like PayPal and Stripe restrict accounts for “adult industry” businesses.
Fun facts
- +77% of Americans have, at one point, tried a sex toy.
- The average dildo bought is 7.52″ long (almost 3″ longer than the average penis size of 4.59″).
- Almost 10% of all sex toys sold are for anal pleasure (sold more often than masturbators).
- 10% of sex toy users don’t tell their partners about it.
- Men perceive the positive effects of using sex toys as higher than women.
- 18% of people have fantasized about sex toys without ever trying them.
- Men buy 71% of all condoms (find more condom statistics here).
- Non-vibrating dildos are most often bought by single men (more than single women, or people in relationships).
- Men use dildos and anal plugs twice as much as they use masturbators.
- Women perceive the negative effects of using sex toys more severely than men
- 35% of women have received a sex toy as a present, which is significantly more than men (20%)
- 72% of women with some sex toy experience regularly use sex toys during solo sex.
- 29% of women have tried using a sex toy designed for penile stimulation during solo sex (e.g., cock ring, masturbators, artificial vaginas, etc.)
- 37% have used a vibrator during intercourse.
- 41% have used a vibrator during foreplay.
- 14% have never cleaned their vibrator.
- 22% only clean their vibrator after use.
- 4.6% only clean their vibrator before use.
- 7% have tried putting a condom over their vibrator.
Sex Toy Interest/demand (all 195 countries analyzed)
Here you’ll see the world’s 195 countries’ interest in sex toys. We have ranked each country’s population from most interested to least interested.
We have tracked 44 different sex toy search queries and had native speakers translate them into each native language. Then the data is based on the number of internet users in each country to give the relative search numbers a comparable size.
So for example are Denmark, Sweden, and the USA the countries that search the most after sex toys on the internet compared to all other countries in the world (as previously mentioned we have adjusted for the differences in the population).
| # | Country | Population | Searches* |
|---|---|---|---|
| 1 | Denmark | 5,792,202 | 118 |
| 2 | Sweden | 10,099,265 | 115 |
| 3 | United States | 331,002,651 | 104 |
| 4 | United Kingdom | 67,886,011 | 96 |
| 5 | Netherlands | 17,134,872 | 88 |
| 6 | Russia | 145,934,462 | 87 |
| 7 | Bulgaria | 6,948,445 | 86 |
| 8 | Italy | 60,461,826 | 84 |
| 9 | Australia | 25,499,884 | 82 |
| 10 | Norway | 5,421,241 | 76 |
| 11 | Romania | 19,237,691 | 76 |
| 12 | Malta | 441,543 | 75 |
| 13 | Croatia | 4,105,267 | 74 |
| 14 | France | 65,273,511 | 74 |
| 15 | Finland | 5,540,720 | 73 |
| 16 | Switzerland | 8,654,622 | 73 |
| 17 | Greece | 10,423,054 | 71 |
| 18 | Ireland | 4,937,786 | 71 |
| 19 | Austria | 9,006,398 | 67 |
| 20 | Armenia | 2,963,243 | 65 |
| 21 | Marshall Islands | 59,191 | 65 |
| 22 | Germany | 83,783,942 | 65 |
| 23 | Portugal | 10,196,709 | 64 |
| 24 | Latvia | 1,886,198 | 64 |
| 25 | Mauritius | 1,271,768 | 62 |
| 26 | Hungary | 9,660,351 | 61 |
| 27 | Canada | 37,742,154 | 59 |
| 28 | Belgium | 11,589,623 | 59 |
| 29 | Ukraine | 43,733,762 | 57 |
| 30 | New Zealand | 4,822,233 | 57 |
| 31 | Poland | 37,846,611 | 57 |
| 32 | Costa Rica | 5,094,118 | 56 |
| 33 | Slovenia | 2,078,938 | 56 |
| 34 | Singapore | 5,850,342 | 55 |
| 35 | Lithuania | 2,722,289 | 54 |
| 36 | Grenada | 112,523 | 54 |
| 37 | Trinidad and Tobago | 1,399,488 | 54 |
| 38 | Iceland | 341,243 | 54 |
| 39 | Slovakia | 5,459,642 | 53 |
| 40 | Spain | 46,754,778 | 53 |
| 41 | Luxembourg | 625,978 | 53 |
| 42 | Serbia | 8,737,371 | 52 |
| 43 | Japan | 126,476,461 | 52 |
| 44 | Cyprus | 1,207,359 | 51 |
| 45 | Estonia | 1,326,535 | 50 |
| 46 | San Marino | 33,931 | 50 |
| 47 | Mexico | 128,932,753 | 50 |
| 48 | Solomon Islands | 686,884 | 50 |
| 49 | Bahamas | 393,244 | 50 |
| 50 | Panama | 4,314,767 | 50 |
| 51 | Brunei | 437,479 | 50 |
| 52 | Belarus | 9,449,323 | 49 |
| 53 | Chile | 19,116,201 | 48 |
| 54 | Suriname | 586,632 | 48 |
| 55 | Turkey | 84,339,067 | 47 |
| 56 | Barbados | 287,375 | 47 |
| 57 | Israel | 8,655,535 | 47 |
| 58 | Czech Republic | 10,708,981 | 47 |
| 59 | Brazil | 212,559,417 | 47 |
| 60 | Antigua and Barbuda | 97,929 | 46 |
| 61 | Bosnia and Herzegovina | 3,280,819 | 46 |
| 62 | Honduras | 9,904,607 | 46 |
| 63 | El Salvador | 6,486,205 | 44 |
| 64 | Guyana | 786,552 | 44 |
| 65 | Saint Kitts & Nevis | 53,199 | 43 |
| 66 | Kazakhstan | 18,776,707 | 43 |
| 67 | St. Vincent & Grenadines | 110,94 | 43 |
| 68 | Belize | 397,628 | 43 |
| 69 | Malaysia | 32,365,999 | 43 |
| 70 | Colombia | 50,882,891 | 42 |
| 71 | Argentina | 45,195,774 | 42 |
| 72 | Maldives | 540,544 | 42 |
| 73 | Algeria | 43,851,044 | 42 |
| 74 | Nicaragua | 6,624,554 | 42 |
| 75 | Jamaica | 2,961,167 | 41 |
| 76 | Uruguay | 3,473,730 | 41 |
| 77 | Guatemala | 17,915,568 | 41 |
| 78 | Moldova | 4,033,963 | 41 |
| 79 | South Korea | 51,269,185 | 40 |
| 80 | Indonesia | 273,523,615 | 40 |
| 81 | Peru | 32,971,854 | 40 |
| 82 | Ecuador | 17,643,054 | 39 |
| 83 | United Arab Emirates | 9,890,402 | 39 |
| 84 | Saint Lucia | 183,627 | 39 |
| 85 | Dominica | 71,986 | 38 |
| 86 | North Macedonia | 2,083,374 | 38 |
| 87 | Georgia | 3,989,167 | 37 |
| 88 | China | 1,439,323,776 | 37 |
| 89 | Myanmar | 54,409,800 | 36 |
| 90 | Seychelles | 98,347 | 36 |
| 91 | Thailand | 69,799,978 | 36 |
| 92 | Qatar | 2,881,053 | 34 |
| 93 | Tunisia | 11,818,619 | 34 |
| 94 | Liechtenstein | 38,128 | 33 |
| 95 | Dominican Republic | 10,847,910 | 32 |
| 96 | Philippines | 109,581,078 | 31 |
| 97 | Namibia | 2,540,905 | 30 |
| 98 | Paraguay | 7,132,538 | 30 |
| 99 | Kyrgyzstan | 6,524,195 | 30 |
| 100 | Timor-Leste | 1,318,445 | 30 |
| 101 | Sri Lanka | 21,413,249 | 29 |
| 102 | South Africa | 59,308,690 | 29 |
| 103 | Turkmenistan | 6,031,200 | 28 |
| 104 | Venezuela | 28,435,940 | 28 |
| 105 | Bolivia | 11,673,021 | 28 |
| 106 | Andorra | 77,265 | 27 |
| 107 | Saudi Arabia | 34,813,871 | 27 |
| 108 | Lebanon | 6,825,445 | 27 |
| 109 | Bahrain | 1,701,575 | 26 |
| 110 | Iraq | 40,222,493 | 25 |
| 111 | Gabon | 2,225,734 | 24 |
| 112 | Kuwait | 4,270,571 | 24 |
| 113 | Albania | 2,877,797 | 23 |
| 114 | Jordan | 10,203,134 | 21 |
| 115 | Montenegro | 628,066 | 21 |
| 116 | Somalia | 15,893,222 | 21 |
| 117 | Djibouti | 988,111 | 20 |
| 118 | Tajikistan | 9,537,645 | 20 |
| 119 | Cambodia | 16,718,965 | 19 |
| 120 | Mongolia | 3,278,290 | 19 |
| 121 | Monaco | 39,242 | 19 |
| 122 | Tanzania | 59,734,218 | 18 |
| 123 | Mozambique | 31,255,435 | 17 |
| 124 | Azerbaijan | 10,139,177 | 17 |
| 125 | Uzbekistan | 33,469,203 | 15 |
| 126 | Pakistan | 220,892,340 | 12 |
| 127 | Vietnam | 97,338,579 | 12 |
| 128 | Morocco | 36,910,560 | 12 |
| 129 | Cabo Verde | 555,987 | 11 |
| 130 | Nepal | 29,136,808 | 10 |
| 131 | Botswana | 2,351,627 | 10 |
| 132 | Haiti | 11,402,528 | 10 |
| 133 | Guinea | 13,132,795 | 10 |
| 134 | Madagascar | 27,691,018 | 10 |
| 135 | Oman | 5,106,626 | 10 |
| 136 | Egypt | 102,334,404 | 10 |
| 137 | Libya | 6,871,292 | 9 |
| 138 | Ghana | 31,072,940 | 8 |
| 139 | Senegal | 16,743,927 | 8 |
| 140 | Bangladesh | 164,689,383 | 8 |
| 141 | India | 1,380,004,385 | 8 |
| 142 | Congo | 5,518,087 | 7 |
| 143 | Lesotho | 2,142,249 | 6 |
| 144 | Benin | 12,123,200 | 6 |
| 145 | Zambia | 18,383,955 | 6 |
| 146 | Afghanistan | 38,928,346 | 5 |
| 147 | Laos | 7,275,560 | 4 |
| 148 | Côte d’Ivoire | 26,378,274 | 4 |
| 149 | Bhutan | 771,608 | 4 |
| 150 | Papua New Guinea | 8,947,024 | 4 |
| 151 | Kenya | 53,771,296 | 4 |
| 152 | Togo | 8,278,724 | 4 |
| 153 | Zimbabwe | 14,862,924 | 3 |
| 154 | Uganda | 45,741,007 | 3 |
| 155 | Niger | 24,206,644 | 3 |
| 156 | Vanuatu | 307,145 | 3 |
| 157 | Mauritania | 4,649,658 | 3 |
| 158 | Sao Tome & Principe | 219,159 | 3 |
| 159 | Cameroon | 26,545,863 | 3 |
| 160 | Yemen | 29,825,964 | 3 |
| 161 | Ethiopia | 114,963,588 | 3 |
| 162 | Gambia | 2,416,668 | 2 |
| 163 | Mali | 20,250,833 | 2 |
| 164 | Angola | 32,866,272 | 2 |
| 165 | Fiji | 896,445 | 2 |
| 166 | Burundi | 11,890,784 | 2 |
| 167 | Malawi | 19,129,952 | 2 |
| 168 | Rwanda | 12,952,218 | 1 |
| 169 | Liberia | 5,057,681 | 1 |
| 170 | DR Congo | 89,561,403 | 1 |
| 171 | Comoros | 869,601 | 1 |
| 172 | Nigeria | 206,139,589 | 1 |
| 173 | Burkina Faso | 20,903,273 | 1 |
| 174 | Chad | 16,425,864 | 1 |
| x | Central African Republic | 4,829,767 | N/A |
| x | Cuba | 11,326,616 | N/A |
| x | Equatorial Guinea | 1,402,985 | N/A |
| x | Eritrea | 3,546,421 | N/A |
| x | Eswatini | 1,160,164 | N/A |
| x | Guinea-Bissau | 1,968,001 | N/A |
| x | Iran | 83,992,949 | N/A |
| x | Kiribati | 119,449 | N/A |
| x | Micronesia | 548,914 | N/A |
| x | Nauru | 10,824 | N/A |
| x | North Korea | 25,778,816 | N/A |
| x | Palau | 18,094 | N/A |
| x | Samoa | 198,414 | N/A |
| x | Sierra Leone | 7,976,983 | N/A |
| x | South Sudan | 11,193,725 | N/A |
| x | State of Palestine | 5,101,414 | N/A |
| x | Sudan | 43,849,260 | N/A |
| x | Syria | 17,500,658 | N/A |
| x | Tonga | 105,695 | N/A |
| x | Tuvalu | 11,792 | N/A |
Methodology
The data in this study is retrieved from multiple sources. References to those available online or sent to us can be found in the reference list. Apart from what is already listed here, we have procured and analyzed several data points including but not limited to industry reports, company economic reports, sales data from individual companies, as well as search and visitor statistics on popular industry-specific websites. On top of this, we have conducted two surveys providing us with longitudinal data on the development over the last 6 years (2017-2023). The two surveys gathered responses from 1760 respondents. Finally, data has been gathered using online scrapers to crawl and scrape information from online directories. In total +30.000 respondents, answers have been analyzed to better understand the world of sex toys with a focussed perspective on the US market.
The analysis was done through data aggregation and averaging. Where multiple sources were available with data discrepancies a weighted average was used. This was based on a subjective measure of the reliability of individual datasets – giving more weight to more reliable datasets. Data treatment and analysis were conducted in Stata 16.0/IC, and both the do-file and the dataset are available upon request for researchcenter@bedbible.com.
References
Ennis, Dawn (13 July 2021). “New Research Reveals Insights Into America’s Nonbinary Youth”
CIA World Factbook
Wilson, Bianca D.M.; Meyer, Ilan H. (June 2021). “Nonbinary LGBTQ Adults in the United States”. Williams Institute.
Decennial Census P.L. 94-171 Redistricting Data”. United States Census Bureau, Population Division.
“2020 U.S. Gazetteer Files”. U.S. Gazetteer Files. United States Census Bureau.
Philip D. Harvey, The Government Vs. Erotica: The Siege of Adam and Eve, Prometheus Books, 2001
Döring, & Poeschl, S. (2020). Experiences with Diverse Sex Toys Among German Heterosexual Adults: Findings From a National Online Survey. The Journal of Sex Research, 57(7), 885–896.
Anderson, Schick, V., Herbenick, D., Dodge, B., & Fortenberry, J. D. (2014). A study of human papillomavirus on vaginally inserted sex toys, before and after cleaning, among women who have sex with women and men. Sexually Transmitted Infections, 90(7), 529–531.
Wood, Crann, S., Cunningham, S., Money, D., & O’Doherty, K. (2017). A cross-sectional survey of sex toy use, characteristics of sex toy use hygiene behaviors, and vulvovaginal health outcomes in Canada. The Canadian Journal of Human Sexuality, 26(3), 196–204.
Herbenick, Reece, M., Sanders, S., Dodge, B., Ghassemi, A., & Fortenberry, J. D. (2009). Prevalence and Characteristics of Vibrator Use by Women in the United States: Results from a Nationally Representative Study. Journal of Sexual Medicine, 6(7), 1857–1866.
Rosenberger, Schick, V., Herbenick, D., Novak, D. S., & Reece, M. (2011). Sex Toy Use by Gay and Bisexual Men in the United States. Archives of Sexual Behavior, 41(2), 449–458.
Frisch M, Moseholm E, Andersson M, Andresen JB, Graugaard C. Sex i Danmark. Nøgletal fra Projekt SEXUS 2017-2018. Statens Serum Institut & Aalborg Universitet, 2019.
https://www.indeed.com/cmp/Adult-Shop/salaries/Retail-Sales-Associate
https://www.bea.gov/sites/default/files/2021-06/qgdpstate0621.pdf
https://www.census.gov/library/visualizations/interactive/2019-median-household-income.html
https://fred.stlouisfed.org/release/tables?eid=259515&rid=249
https://www.grandviewresearch.com/industry-analysis/sex-toys-market
https://www.statista.com/statistics/1276720/china-market-size-of-adult-products/
https://www.intomore.com/culture/three-out-of-four-americans-have-dildos/
https://www.webmd.com/sex-relationships/news/20041007/sex-toys-more-common-in-women-in-relationships
